|
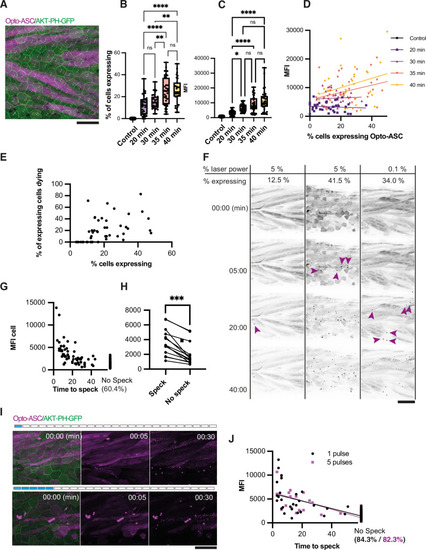
Effect of heat shock and light exposure. (A) Periderm in a larva expressing Opto-ASC (magenta) and AKT-PH-GFP to mark membranes (green) at 16 hr post heat shock (hrpHS). Cells are individually numbered for subsequent quantification of ASC expression. Opto-ASC in this figure is mainly visible in muscles underlying the epidermis, which are seen in this maximum Z-projection. For quantification of Asc-expressing periderm cells, individual z-planes within the periderm are evaluated. Scale bar: 50 µm (B–D) Dependence of Opto-ASC expression on heat-shock protocol. (B) Percentage of Opto-ASC expressing cells and (C). overall mean fluorescence intensity (MFI, measured on max projections) in larvae heat-shocked for different time periods (N>29 for each condition; each dot represents one larva). (D) Correlation between percentage of Opto-ASC-expressing cells and overall MFI for all larvae for each condition measured in B (N=136/>29 per condition). (E) Correlation between the percentage of Opto-ASC expressing cells and the number of expressing cells dying within 60 min (N=47 movies; each dot one larva); all movies at 1 min frame rate, 5% relative laser power. (F) Examples of larvae expressing Opto-ASC after exposure to 488 laser light at different laser powers. The number of Opto-ASC expressing periderm cells (shown as % positive cells) does not correlate strictly with the level of laser power, nor does the expression level in the underlying muscles. If a sufficient number of periderm cells are positive, specks are formed even at low laser power. First appearance of specks is indicated by magenta arrows. (G) Correlation between MFI of Opto-ASC in single cells and the time from beginning of 488 laser light exposure to speck formation. Cells were followed for 60 min; 60.4% of the cells had not formed a speck at this time. N=156 cells from 14 different larvae. (H) Comparison of average MFI between Opto-ASC expressing cells in individual larvae that form and do not form a speck within 60 min (N=15 individual larvae). The values representing the average MFI for speck-forming and non-speck-forming cells for each larva are connected by a line; p<0.001. (I) Time lapse of Opto-ASC expressing larva exposed to a single or to 5 laser light pulses (1 or 5 frames acquired with 488 laser light). Scale bar is 50 µm. (J) Correlation between MFI of single cells and onset of speck formation in cells exposed to either 1 (red circles) or 5 (black outlined squares) pulses of 488 laser light. Cells were followed for 60 min. N=164 cells in 9 larvae for 1 pulse, N=86 cells in 5 larvae for 5 pulses.
|