
Figure 1—figure supplement 1.
- ID
- ZDB-FIG-230710-18
- Publication
- Hasel de Carvalho et al., 2023 - The Opto-inflammasome in zebrafish as a tool to study cell and tissue responses to speck formation and cell death
- Other Figures
-
- Figure 1—figure supplement 1.
- Figure 1—figure supplement 1.
- Figure 2.
- Figure 3—figure supplement 1.
- Figure 3—figure supplement 1.
- Figure 4.
- Figure 5.
- Figure 6—figure supplement 1.
- Figure 6—figure supplement 1.
- Figure 6—figure supplement 2.
- Figure 6—figure supplement 3.
- Figure 7—figure supplement 1.
- Figure 7—figure supplement 1.
- Figure 7—figure supplement 2.
- Figure 8—figure supplement 1.
- Figure 8—figure supplement 1.
- Figure 8—figure supplement 2.
- All Figure Page
- Back to All Figure Page
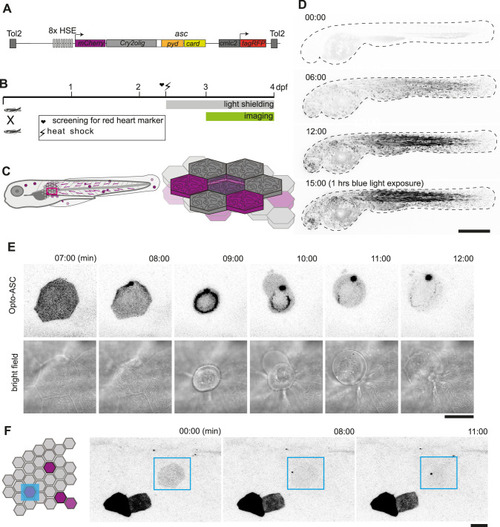
Optogenetic tools for ASC-dependent inflammasome formation. (A) The optogenetic construct (Opto-ASC) consists of a heat shock element placed upstream of a cassette containing the sequences for mCherry, the photoactuator Cry2olig domain and asc, followed by a cassette containing the “red heart” marker cmlc2:tagRFP. The two cassettes are placed between Tol2 sites for insertion into the genome. (B) Experimental set-up: Progeny from the transgenic lines are first screened for the expression of the red heart marker at 2 dpf. Positive larvae expressing cmlc2:tagRFP are heat-shocked and kept in dark conditions to prevent spontaneous Opto-ASC activation throughout the experiment. Imaging is performed at 3 dpf. (C) Schematic depicting the stochastic expression of Opto-ASC. Left: overview of larva; right: diagram of the epidermis with the periderm on top (dark colour) and basal cell layer below (light colour). (D) Time lapse images of 3dpf larva expressing Opto-ASC. Expression of Opto-ASC becomes detectable at 6 hr post heat shock. The frame rate is 15 min, time points are hours after heat shock, scale bar is 200 µm. (E–F) Example of Opto-ASC forming specks in the epithelial layer of 3dpf larva expressing Opto-ASC. Scale bars are 20 µm. (E) Time-lapse imaging after 488 nm laser illumination of the periderm cells. Top row: ASC-expressing cell forming a speck (t=8 mins). Bottom row: morphology of the dying cell in bright field. Within a minute of speck formation, the cell changes morphology and is extruded. All bright field images are at the plane of the periderm cells; fluorescent images are z-projections 30 planes (z=1 µm). (F) Local activation of Opto-ASC in a single cell. Diagram of periderm showing four cells expressing Opto-ASC and region of optogenetic activation (blue square). The cell with the lowest expression of Opto-ASC was illuminated by 2-photon laser. Only this cell forms a speck. |