
FIGURE
Figure 5
- ID
- ZDB-FIG-230630-93
- Publication
- Henderson et al., 2023 - Chronic Vitamin E Deficiency Dysregulates Purine, Phospholipid, and Amino Acid Metabolism in Aging Zebrafish Skeletal Muscle
- Other Figures
- All Figure Page
- Back to All Figure Page
Figure 5
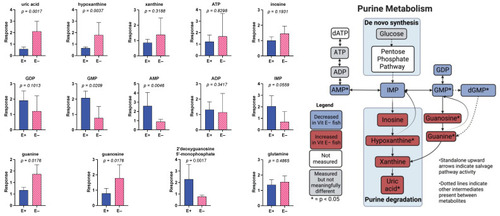
Purine metabolism is altered in E− zebrafish muscle at 18 months. Bar graphs showing Student’s |
Expression Data
Expression Detail
Antibody Labeling
Phenotype Data
Phenotype Detail
Acknowledgments
This image is the copyrighted work of the attributed author or publisher, and
ZFIN has permission only to display this image to its users.
Additional permissions should be obtained from the applicable author or publisher of the image.
Full text @ Antioxidants (Basel)