
FIGURE
Fig. 8
Fig. 8
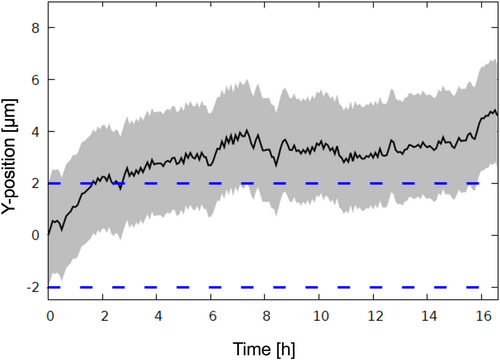
Drift of the laser beam position in y-direction in the sample plane as a function of time. The plot shows the positional drift of the laser beam center (black line) that was measured by the correction procedures. The measured drift between two subsequent images was used to generate a feedback signal to the scanning mirror, which kept the laser center in a conjugate position to the center of the virtual detector. The 1/e2-radius
|
Expression Data
Expression Detail
Antibody Labeling
Phenotype Data
Phenotype Detail
Acknowledgments
This image is the copyrighted work of the attributed author or publisher, and
ZFIN has permission only to display this image to its users.
Additional permissions should be obtained from the applicable author or publisher of the image.
Full text @ Microsc. Res. Tech.