
- Title
-
Automatic detector synchronization for long-term imaging using confocal light-sheet microscopy
- Authors
- Harder, A., Nagarajan, B., Odermatt, B., Kubitscheck, U.
- Source
- Full text @ Microsc. Res. Tech.
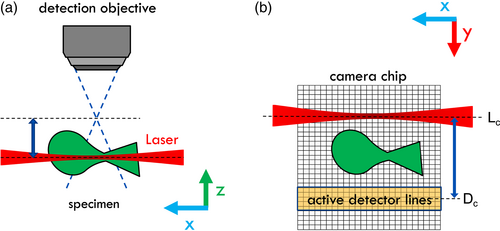
Imaging geometry. (a) Side view with axial defocus indicated by the dark blue arrow. (b) Top view. Here, the image of the illumination laser beam at position Lc does not coincide with the center of the active detector lines Dc of the camera in the image plane.
|
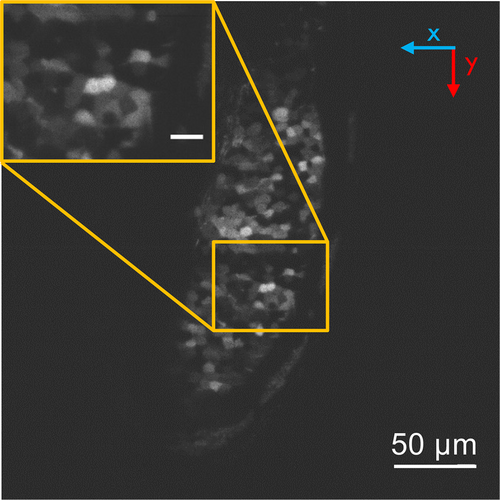
Overview image of the brain (optic tectum) of an eGFP-reporter zfl. |
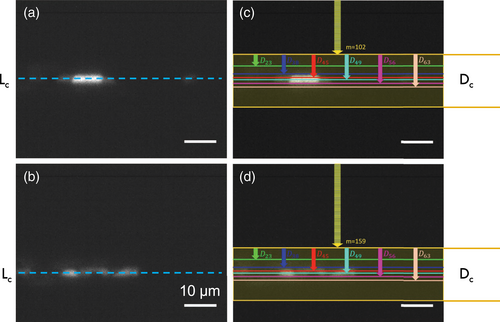
Synchronization of illumination and detection. (a,b) Exemplary recordings
|

Exemplary reconstructed images
|
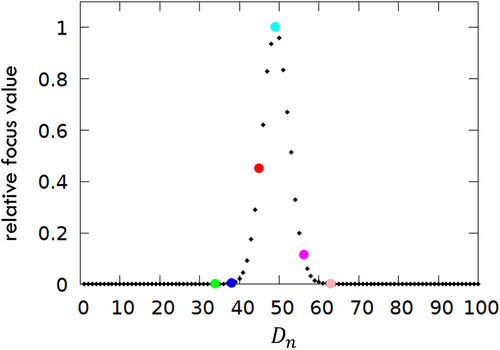
Relative focus values determined by Equation (1) for the images
|
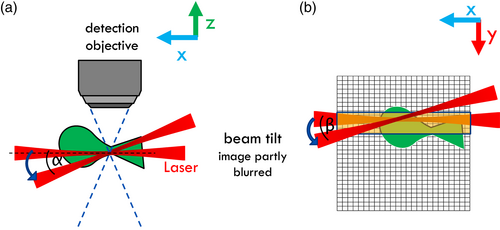
Effect of beam tilting. (a) Side view, (b) top view |
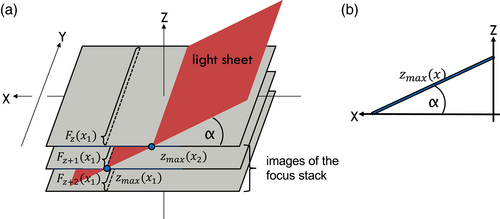
Determination of the beam tilt α in the xz-plane. (a) Three selected image planes from the z-focus stack. The light sheet intersects the image stack at different positions xi. These positions are designated as
|
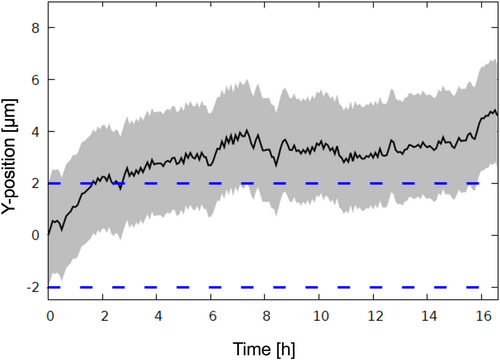
Drift of the laser beam position in y-direction in the sample plane as a function of time. The plot shows the positional drift of the laser beam center (black line) that was measured by the correction procedures. The measured drift between two subsequent images was used to generate a feedback signal to the scanning mirror, which kept the laser center in a conjugate position to the center of the virtual detector. The 1/e2-radius
|

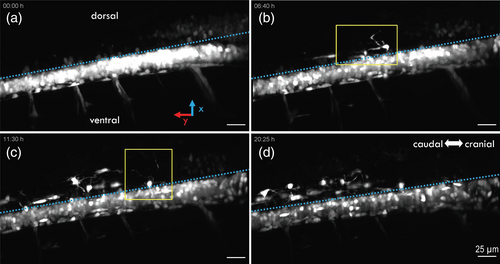
MIPs along z-direction in the spinal cord of a two-day-old Tg(olig2:eGFP) zfl. The blue dashed line separates the dorsal from the ventral area (main cords). (a) t = 0 h, (b) t = 6:40 h, (c) t = 11:30 h, and (d) t = 20:25 h. the image areas indicated by yellow frames are shown magnified and at higher time resolution in Figures 12 and 13. See also Movie S1. Image brightness and contrast were increased for visualization without applying a gamma correction in order to pronounce the fine image details. The recorded raw images were far from being oversaturated.
|
MIPs along y-direction in the spinal cord of a two-day-old Tg(olig2:eGFP) zfl derived from the same image stack as shown in Figure 9. (a) t = 0 h, (b) t = 6:40 h, (c) t = 11:30 h, and (d) t = 20:25 h. the blue dashed lines in D separate the dorsal from the ventral area (main cords). Image brightness and contrast were increased for visualization without applying a gamma correction in order to pronounce the fine image details. The recorded raw images were far from being oversaturated.
|
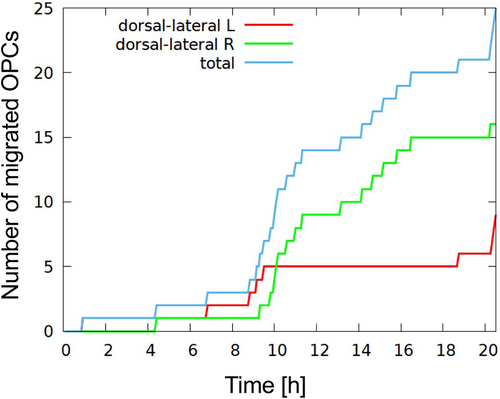
Number of ventral to dorsal migrated OPCs during the long-term measurement. Only about half as many migration events were detected in the left area as in the right. Since the left side was further away from the detection objective, the image quality was lower in this area and it was more difficult to make out individual cells.
|
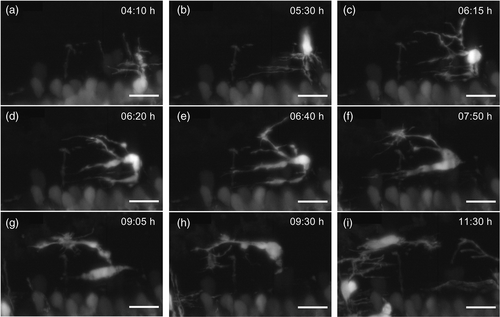
Magnification of the dorsal migration process and search movements of the cell processes of an OPC (Movie S3). The images show MIPs of the yellow marked area in Figure 9b. A gamma correction (factor of 0.5) was applied to improve the contrast of the relatively dark branches of the cell extensions
|
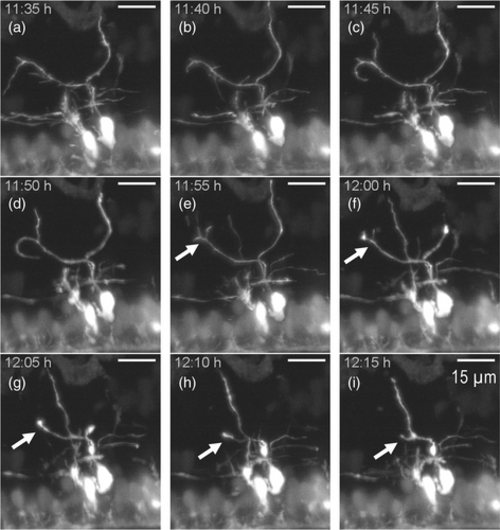
Magnification of a second OPC exploring its surroundings (Movie S4). MIP of the area marked by the yellow frame in Figure 9c. (a–d) The cell explores its surroundings with its cellular processes. (e–i) One cell process rapidly gets retracted to the cell body (white arrows in e–g). A gamma correction (factor 0.5) was used to adjust the image contrast.
|