
Fig. 3
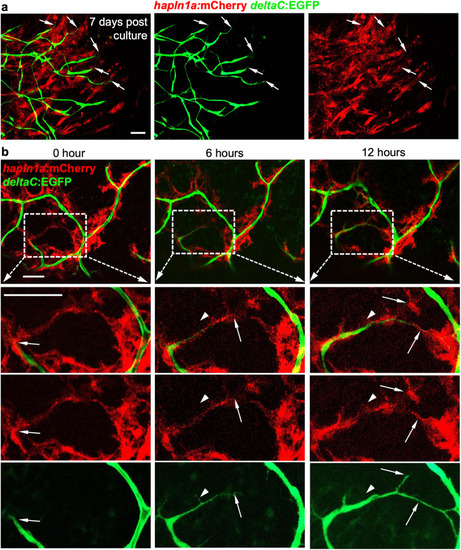
a Visualization of the growth of deltaC:EGFP+ and hapln1a:mCherry+ tissues from deltaC:EGFP;hapln1a:mCherry hearts over 7 days after in vitro culture. deltaC:EGFP+ tissue growth is clearly lagging behind hapln1a:mCherry+ cells. Arrows represent growing coronary extensions. Total 5 tissue aggregates were examined. The experiments were repeated two times independently with similar results. Scale bar, 50 µm. b Live imaging of hapln1a+ and deltaC+ cells in the ventricular surface of ex vivo juvenile hearts by 0, 6, and 12 h, respectively. Total 12 hearts were observed from three independently experiments with similar results. Visualization of deltaC:EGFP+ coronary growth following existing hapln1a+ cell shears is clear (32 out of 39 observed extension growth). Arrows represent growing coronary tips. Arrowheads represent growing deltaC+ tips lacking hapln1a+ linear cell structures. Scale bar, 50 µm. |