
Figure 2
- ID
- ZDB-FIG-230520-2
- Publication
- Bastos et al., 2023 - A novel insight on SARS-CoV-2 S-derived fragments in the control of the host immunity
- Other Figures
- All Figure Page
- Back to All Figure Page
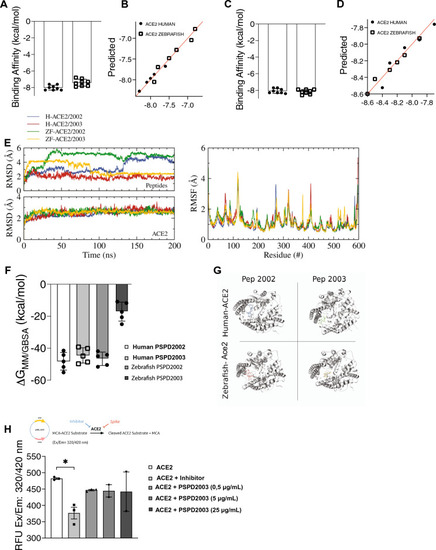
Affinity and binding stability between S-derived peptides and the ACE2 receptor. (A) and (C) Molecular dynamics analysis of interaction strength between PSPD2002 (A) or PSPD2003 (C) and ACE2 receptor of human and zebrafish, and predictive values for PSPD2002 (B) or PSPD2003 (D). (E) Analysis of the convergence and stability of the interaction of proteases over 200 ns for peptides (top) and ACE2 (bottom), from RMSD (root-mean-square deviation) analysis (left). Fluctuation analysis of the different residues of the proteases using RMSF (root-mean-square fluctuation) docking (right). (F) Analysis of the binding free energy during 100 ns of stimulation, between both peptides (PSPD2002 and PSPD2003) and the human and zebrafish Ace2 receptors. (G) Graphical representation showing the interaction regions between the PSPD2002 and PSPD2003 fragments with the proteases of the quaternary structure of the human and zebrafish Ace2 receptors. (H) Expression of ACE2 in Saccharomyces cerevisiae strain. The analysis of the catalytic activity of the receptor against the synthetic inhibitor (control) and different concentrations of the peptides was quantified from the Relative Fluorescence Unit (RFU) read in excitation range of 320 nm and emission range of 420 nm (Ex/Em: 320/420). Å: angstrom, a unit of length equivalent to 0.1 nm. MM/GBSA: Molecular mechanics generalized Born surface area. *p < 0.05. |