
Fig. 4
- ID
- ZDB-FIG-230515-106
- Publication
- Potts et al., 2022 - Splicing factor deficits render hematopoietic stem and progenitor cells sensitive to STAT3 inhibition
- Other Figures
- All Figure Page
- Back to All Figure Page
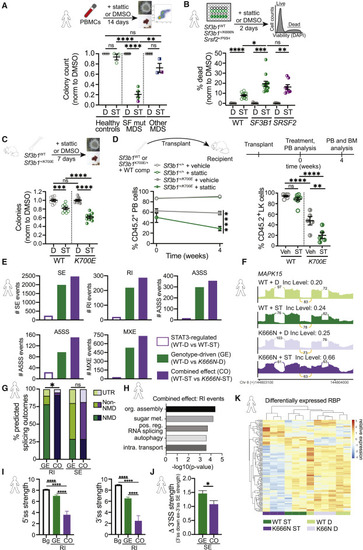
Figure 4. STAT3 inhibition impacts splicing factor mutant mammalian HSPC viability and splicing (A) Experimental strategy schematic (top): human H4434 methylcellulose colony-forming unit (CFU) assay of peripheral blood mononuclear cells (PBMCs) isolated from healthy controls (open circles), splicing factor only mutant MDS patients (filled circles; SF3B1, green; SRSF2, purple), and other mutant MDS patients (filled squares; non-splicing factor mutations only, blue; non-splicing factor + SRSF2 mutations, purple) treated with STAT3 inhibitor stattic (1 μM) or DMSO control. Colonies were counted after 14 days (bottom). Values normalized to DMSO control. n = 3 healthy controls, n = 4 splicing factor mutant MDS, n = 3 other mutant MDS. ANOVA; ns, not significant, ∗∗p < 0.01, ∗∗∗∗p < 0.0001. (B) Experimental strategy schematic (top): isogenic human K562 cell lines with MDS-associated SF3B1+/K666N or SRSF2+/P95H point mutations or WT control were treated with stattic (ST) (2 μM) or DMSO (D) control. Viability (DAPI exclusion) was analyzed by flow cytometry after 2 days of culture. Values normalized to DMSO control (viability). n = 8. ANOVA; ∗p < 0.05, ∗∗∗p < 0.001, ∗∗∗∗p < 0.0001. (C) Experimental strategy schematic (top): mouse M3434 methylcellulose colony-forming units (CFU) assay of cKit-enriched bone marrow cells isolated from Mx1-Cre:Sf3b1+/+ or Mx1-Cre:Sf3b1+/K700E mice treated with stattic (0.75 μM) or DMSO control. Colonies were counted after 7 days (bottom). Values normalized to DMSO control. n = 8. ANOVA; ns, not significant, ∗∗∗p < 0.001, ∗∗∗∗p < 0.0001. (D) Experimental strategy schematic (top): 4 weeks after pIpC induction, unfractionated bone marrow cells from either Mx1-Cre:Sf3b1+/+ or Mx1-Cre:Sf3b1+/K700E CD45.2+ mice were competitively transplanted into lethally irradiated CD45.1+ recipients. After reconstitution (time = 0 weeks), treatment with vehicle or stattic was performed for 4 weeks. Quantification of CD45.2+ donor chimerism (bottom) in peripheral blood (left) and BM LK population (right) in recipients treated with vehicle or stattic. n = 5–8 mice per group. ANOVA; ns, not significant, ∗p < 0.05, ∗∗p < 0.01, ∗∗∗∗p < 0.0001. (E) Human K562 cells (SF3B1WT or SF3B1+/K666N) were treated with stattic (10 μM, 24 h) then total RNA was isolated for RNA-seq and analyzed using rMATS. Quantitation of alternative splicing events occurring in each condition comparison (STAT3-regulated, genotype-driven, and combined effect of STAT3 and genotype), separated by type of splicing event. STAT3-regulated genes were significantly altered between SF3B1WT cells treated with stattic versus DMSO. Genotype-driven is defined as genes found differentially spliced between SF3B1WT and SF3B1+/K666N cells treated with DMSO. Combined effect was a comparison of SF3B1WT cells + stattic versus SF3B1+/K666N cells + stattic. SE, cassette (skipped) exon; RI, retained intron; A3SS, alternative 3′ splice site; A5SS, alternative 5′ splice site; MXE, mutually exclusive exon; ST, stattic; D, DMSO. (F) Sashimi plot of combined effect RI event in MAPK15 in SF3B1WT (WT) or SF3B1+/K666N (K666N) K562 cells treated with DMSO (D) or STAT3 inhibitor stattic (ST). Stattic treatment had a more pronounced impact on intron retention (orange) in K666N mutant cells than WT cells. Inc Level is the average inclusion for the impacted intron retention event (orange). Numbers on plots depict average number of reads across replicates supporting the event. (G) Graph depicting the percentage of alternatively spliced isoforms (RI, retained introns; SE, skipped exons) in genotype-driven (GE) and combined effect (CO) splicing events that are predicted to result in nonsense-mediated (NMD) decay, protein sequence alterations (non-NMD), or changes in untranslated regions (UTR). Student’s t test; ns, not significant, ∗p < 0.05. (H) Pathway analysis of combined effect genes significantly altered resulting in retained intron (RI) in SF3B1+/K666N cells in the stattic-treated samples. (I) Graphs showing the average 5′ ss (left) and 3′ ss (right) strengths in control background (Bg) sequences flanking genotype-driven (GE) and combined effect (CO) RI events. ANOVA; ∗∗∗∗p < 0.0001. (J) Graph depicting the difference (Δ) in 3′ ss strength between the competing downstream and skipped exon 3′ ss in genotype-driven (GE) and combined effect (CO) SE events. Student’s t test; ∗p < 0.05. (K) Expression levels of RNA binding proteins differentially expressed between DMSO (D) versus STAT3 inhibitor stattic (ST)-treated SF3B1WT (WT) or SF3B1+/K666N (K666N) K562 cells. Each row represents the relative expression of an individual gene across samples and each column represents a separate biological replicate color coded according to genotype + drug treatment. Genes with an adjusted p < 0.05 between stattic versus DMSO samples are shown. For all graphs, error bars are standard error mean (SEM). See also Figures S6 and S7. |