
Fig. 2
- ID
- ZDB-FIG-230515-104
- Publication
- Potts et al., 2022 - Splicing factor deficits render hematopoietic stem and progenitor cells sensitive to STAT3 inhibition
- Other Figures
- All Figure Page
- Back to All Figure Page
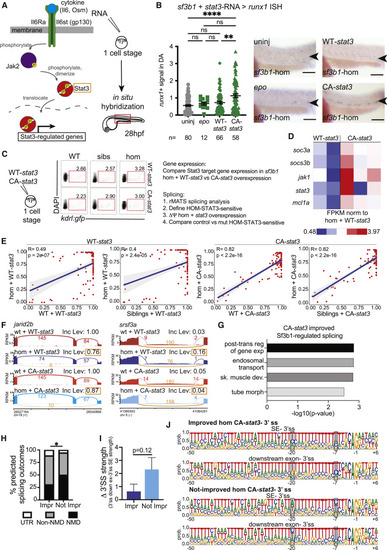
Constitutively active Stat3 signaling partially restores HSPC production in sf3b1 mutants (A) Schematic of Jak/Stat signaling pathway (left). Genes overexpressed are indicated (orange box). Experimental strategy (right): in-vitro-transcribed RNA of target genes was injected into sf3b1 heterozygote incross zebrafish embryos (one-cell stage), then samples fixed at 28 hpf for in situ hybridization using HSPC marker runx1. (B) Representative in situ hybridization (ISH) images of runx1 signal in dorsal aorta (DA) (arrowheads) of sf3b1 homozygous (hom) embryos (right) and quantification of DA runx1 signal in embryos with dots representing individual embryos (left). In-vitro-transcribed RNA injected included: erythropoietin (epo), WT (WT)-stat3, or constitutively active (CA)-stat3. ANOVA; ns, not significant, ∗∗p < 0.01, ∗∗∗∗p < 0.0001. Scale bar, 100 μM. (C) Experimental strategy schematic: in-vitro-transcribed RNA (WT-stat3 or CA-stat3) was injected into one-cell stage embryos derived from sf3b1 heterozygote or WT incrosses, then 24 hpf kdrl:gfp+ endothelial cells were FACS-isolated from each group. RNA-seq data were subjected to gene expression and rMATS splicing analyses. Differential splicing events (FDR < 0.05) were identified between homozygotes injected with WT-stat3 and CA-stat3 (defined as HOM-STAT3 sensitive), then these events were compared in homozygotes versus controls (WT or siblings) injected with WT-stat3 or CA-stat3. (D) Gene expression heatmap of selected Stat3 targets in RNA-seq data from the sf3b1 homozygote rescue experiment. FPKM normalized to homozygotes + WT-stat3. FPKM, fragments per kilobase of transcript per million mapped reads. Each heatmap column represents a separate biological replicate. (E) Scatterplots displaying mean inclusion levels for HOM-STAT3-sensitive skipped exon events in WT or sibling controls and sf3b1 homozygotes injected with WT-stat3 (control, left) or CA-stat3 (right). Solid blue line represents the correlation coefficient between samples with the gray-shaded area denoting the 95% confidence interval. p values calculated for Pearson’s correlation coefficient(R). (F) Sashimi plots showing exon inclusion levels in jarid2b and srsf3a in WT and sf3b1 homozygotes injected with CA-stat3 (lower) compared with WT-stat3 (upper). Expression of CA-stat3 in sf3b1 homozygotes significantly improved exon inclusion in both transcripts toward WT + WT-stat3 levels (orange box). Inc Level is the average inclusion for the indicated splicing event (orange). Numbers on plots depict average number of reads across replicates supporting the event. (G) Pathway analysis of genes with improved splicing in sf3b1 homozygous mutants with CA-stat3 overexpression. post-trans, post-transcriptional; reg, regulation; exp, expression; sk, skeletal; de, development; morph, morphogenesis. (H) Graph depicting the percentage of alternative exon-skipping isoforms in sf3b1 homozygous mutants that were improved or not by CA-stat3 expression that are predicted to result in nonsense-mediated (NMD) decay, protein sequence alterations (non-NMD), or changes in untranslated regions (UTR). Chi-square; ∗p < 0.05. (I) Graph depicting the difference (Δ) in 3′ splice site (ss) strengths between the competing downstream and skipped exons in HOM-STAT3-sensitive SE events that were improved or not by CA-stat3 expression. Student’s t test. (J) Weblogo representations of the 3′ ss and flanking sequences in the competing downstream and skipped exons in the SE events that were improved or not by CA-stat3 expression. Highlighted blue areas show different base preferences in not-improved SE events compared with the other groups. Sequences shown are 50 intronic +6 exonic bases relative to the intron-exon junction. Height of each base represents the relative proportion at the noted position. For all graphs, error bars are standard error mean (SEM). See also Figure S2. |