
Fig. 4
- ID
- ZDB-FIG-230510-9
- Publication
- Economou et al., 2022 - Nodal signaling establishes a competency window for stochastic cell fate switching
- Other Figures
- All Figure Page
- Back to All Figure Page
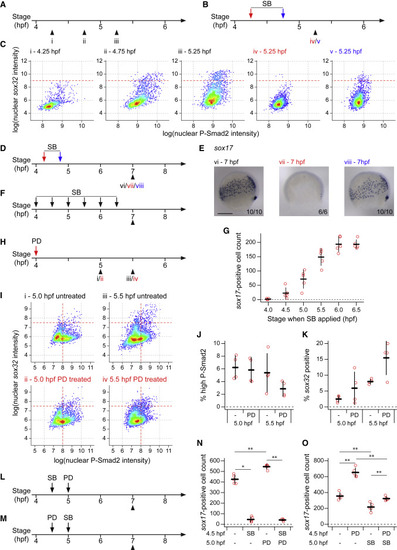
Endoderm progenitors require Nodal signaling for their induction but not maintenance (A–C) Schematics showing collection times of untreated embryos (A) and timings of SB-505124 (SB) application and embryo collection (B) for plots shown in (C). Colors of roman numerals correspond to the treatment (red and blue correspond to arrows in B, black to no SB). Density scatter plots showing nuclear intensity staining for P-Smad2 and sox32 for all cells in cell tiers 1–2 pooled from four embryos for each condition (C). Dashed red lines indicate threshold defining sox32-positive cells. (D and E) As in (B), but showing the timing of SB application and embryo collection for embryos in (E). Colors of roman numerals as in (A) and (B). Representative embryo following WISH for sox17 (E). Roman numerals refer to the schematics in (D). Dorsal to right; animal pole, top. Numbers in the bottom right refer to the number of embryos showing the phenotype out of the total number studied. (F) As in (B), but showing the timings of SB application and embryo collection for (G). (G) Quantification of sox17-positive cell numbers for embryos treated with SB as in (F). Means from five embryos per condition ± SD shown. For comparison, note that for DMSO-treated embryos the mean cell count is 260.8 and the SD, 18.14. (H) As in (B), but showing the timing of PD-0325901 (PD) application and embryo collection for (I). Roman numerals in red indicates PD treatment. (I) As in (C), but Roman numerals correspond to treatments as defined in (H). Horizontal dashed red lines indicate threshold defining sox32-positive cells. (J) Plot showing the percentage of cells in (I) with high P-Smad2 (as defined by vertical dashed red lines in (I)) for each treatment condition. Means ± SD are shown. (K) As in (J), but showing the percentage of high P-Smad2 cells in (I) which are sox32-positive (as defined by horizontal dashed red lines in I) for each treatment condition. Means ± SD are shown. (L and M) As in (B), but showing the timings of treatment with SB and PD and embryo collection for plots in (N and O). (N and O) Quantification of sox17-positive cells number for embryos treated with SB and PD as defined in (L) and (M), respectively. Means ± SD are shown. See also Figure S4. Scale bars: 250 μm (E). ∗p < 0.05; ∗∗p < 0.01 |
Reprinted from Developmental Cell, 57, Economou, A.D., Guglielmi, L., East, P., Hill, C.S., Nodal signaling establishes a competency window for stochastic cell fate switching, 26042622.e52604-2622.e5, Copyright (2022) with permission from Elsevier. Full text @ Dev. Cell