
Fig. 7
- ID
- ZDB-FIG-230510-12
- Publication
- Economou et al., 2022 - Nodal signaling establishes a competency window for stochastic cell fate switching
- Other Figures
- All Figure Page
- Back to All Figure Page
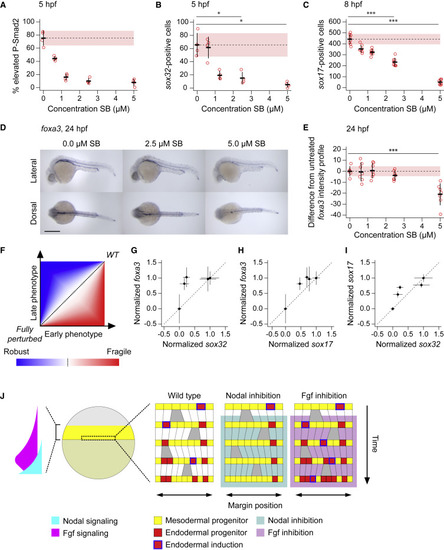
Endoderm induction is robust to variation in initial progenitor number (A) Plot showing percentage of cells in cell tiers 1 and 2 with elevated staining intensity for P-Smad2,for 5-hpf embryos treated at 4 hpf with different doses of SB-505124. Elevated P-Smad2 is defined by the mean background level for all embryos, with background for each embryo defined by the 99th percentile in P-Smad2 staining intensity for cell tiers 9 and 10. Four embryos per dose. Means ± SD are shown. (B) Number of sox32-positive cells for the same embryos as in (A). Means ± SD are shown. (C) Number of sox17-positive cells for 8-hpf embryos treated at 4 hpf with different doses of SB-505124. Eight embryos per dose. Means ± SD are shown. (D) Representative 24-hpf embryos showing foxa3 expression on treatment with different doses of SB-505124 in dorsal and lateral views. Anterior to left; in lateral view dorsal is up. (E) Quantification of the deviation of the foxa3 staining intensity profile from the mean untreated, for 24-hpf embryos treated at 4 hpf with different doses of SB-505124. Means ± SD are shown. Note that in A–C and E, dashed line denotes untreated mean, with pink shaded area as one SD. (F) Schematic illustrating robustness and fragility in developmental systems, through plotting developmental states of embryos at early versus late time points under a range of perturbation from wild type (WT) to fully perturbed. The blue region, where the deviation from WT is greater at early stages under a given strength perturbation (relative to fully perturbed case), represents robustness, while the red area where the converse is true, represents fragility. (G–I) Comparison of early endoderm development with later measures using quantifications in (B, C, and E) to identify robustness in development as described in (F). Comparison of sox32 counts at 5 hpf with foxa3 expression profiles at 24 hpf (G). Comparison of sox17 counts at 8 hpf with foxa3 expression profiles at 24 hpf (H). Comparison of sox32 counts at 5 hpf with sox17 counts at 8 hpf (I). (J) Model of endoderm progenitor specification in early zebrafish development. The Nodal and Fgf gradients at the margin are schematized3. For details, see text. See also Figure S7. Scale bars: 250 μm (D). ∗p < 0.05; ∗∗∗p < 0.001 |
Reprinted from Developmental Cell, 57, Economou, A.D., Guglielmi, L., East, P., Hill, C.S., Nodal signaling establishes a competency window for stochastic cell fate switching, 26042622.e52604-2622.e5, Copyright (2022) with permission from Elsevier. Full text @ Dev. Cell