
- Title
-
Nodal signaling establishes a competency window for stochastic cell fate switching
- Authors
- Economou, A.D., Guglielmi, L., East, P., Hill, C.S.
- Source
- Full text @ Dev. Cell
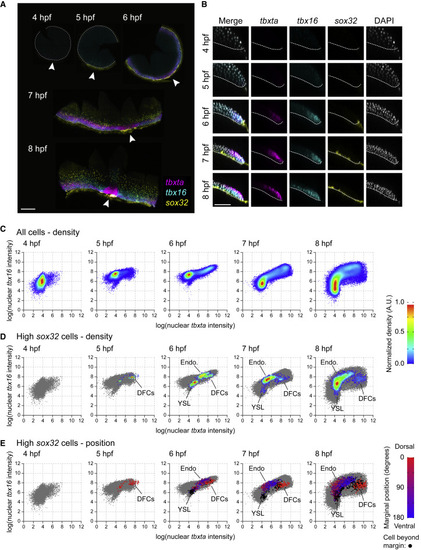
sox32-expressing endoderm progenitors emerge from a population of tbxta/tbx16-positive progenitors (A) Time series showing maximum intensity projections (MIP) of RNAscope for tbxta, tbx16 and sox32. Dashed white line, embryo margin; arrowhead, dorsal. (B) Z-reconstruction through the lateral regions of the embryos in (A). Dashed line marks boundary between embryo and YSL. Colors as in (A); nuclei marked with DAPI (gray). (C) Density scatter plots showing nuclear intensity staining for tbxta and tbx16 for all cells pooled from four embryos for each time point. (D) As in (C), but showing cells with elevated sox32 expression (defined as log[nuclear sox32 intensity] > 8.5) in the context of all cells (gray). The density scale in (C) and (D) is normalized to a maximum density of 1.0 for each plot. (E) Scatter plots from (D) colored to show the position of the closest point at the margin of the embryo from dorsal (0 degrees: red) to ventral (180 degrees: blue). Lateral regions on both sides of each embryo are given the same positional value. Nuclei beyond the margin are marked in black. Populations of cells in (D) and (E) composed predominantly of black cells or red cells are YSL and dorsal forerunner (DFCs), respectively. The remaining cells are endodermal progenitors (Endo). See also Figure S1 Scale bars: 250 μm (A), 100 μm (B). |
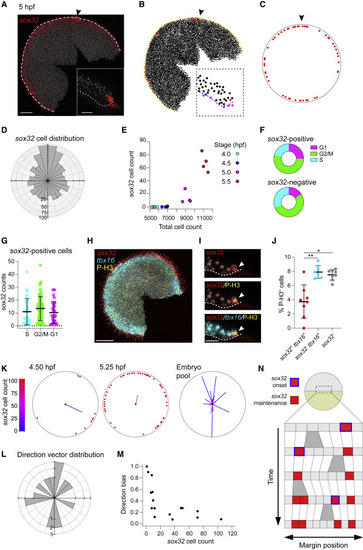
sox32-positive cells are induced randomly within the first two cell tiers (A) MIP of RNAscope for sox32 in a 5 hpf embryo. Nuclei marked with DAPI (gray). Dashed white line, embryo margin; arrowhead, dorsal. Inset: Z-reconstruction through the lateral regions of embryo. (B) Digitization of embryo in (A) showing the centroids from segmentation of all nuclei in the embryo. sox32-positive cells are marked in red. Yellow line, embryo margin; arrowhead, dorsal. Inset: Positions of all nuclear centroids from inset in (A). YSL and cells beyond the margin, and thus eliminated from the analysis, are labeled in magenta. Blue dashed line, embryo margin. (C) Reconstruction of embryo in (B) showing the position of sox32-positive cells (red). Arrowhead, dorsal. (D) Distribution of 827 sox32-positive cells around the margin for 20 embryos collected from 4.25 to 5.25 hpf. Note that dorsal enrichment corresponds to DFCs. Dorsal, up. (E) Relationship between sox32-positive cells (YSL and DFCs removed) and total cell number for embryos collected at 30 min intervals from a single clutch. Colors indicate embryonic stage. (F) Donut graphs from the scRNA-seq dataset showing the percentage of cells in G1, G2/M or S phase for sox32-positive cells (above) and sox32-negative cells (below). (G) Scatterplot from the scRNA-seq dataset showing sox32 expression levels in sox32-positive cells falling in the different phases of the cell cycle. Means ± SD are shown. Dotted line shows zero. (H) MIP of RNAscope for sox32 (red) and tbx16 (cyan) combined with immunofluorescence (IF) for P-H3 (yellow) in a 5-hpf embryo. Nuclei are marked with DAPI (gray). (I) Z-reconstruction through the lateral regions of the embryo shown in (H). Dashed white line, embryo margin. Arrowhead shows a cell positive for sox32, tbx16, and P-H3. (J) Scatter dot plot showing percentage of cells staining for P-H3 among cells that are sox32+ and tbx16+, sox32– and tbx16+, or sox32–. Means ± SD are shown. (K) Two representative embryos showing the distribution of sox32-positive cells around the margin. Average direction vector shown on each embryo. Length indicates direction bias and color indicates the total number of sox32-positive cells. Embryo pool shows vectors from the 20 embryos in (D) (only 16 vectors are shown, as the four youngest embryos have no progenitors). Dorsal, up. (L) Distribution of average direction vectors for the 16 embryos in (K), grouped into 15-degree bins. Dorsal, up. (M) Plot of direction bias against total number of sox32-positive endodermal progenitors for the 16 embryos in (K). (N) Proposed model for the appearance of sox32-positive endodermal progenitors. A series of cells at the margin of the embryo proliferate through time (gray bifurcations). In a random manner, cells turn on sox32 (blue outlined cells), and expression is maintained (red cells). See also Figure S2. Scale bars: 125 μm (A), 50 μm (A, inset), 200 μm (H), 28 μm (I). ∗p < 0.05; ∗∗p < 0.01. |
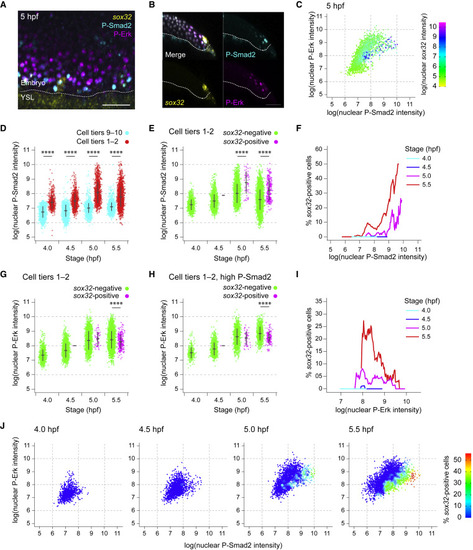
Levels of Nodal and Fgf signaling are not deterministic for endoderm progenitor induction (A) MIP through the margin of a 5-hpf embryo showing IF for P-Smad2 and P-Erk, with RNAscope for sox32. Dashed white line, embryo margin. (B) Z-reconstruction through the lateral regions of the embryo in (A) showing sox32 expression in endodermal progenitors relative to P-Smad2 and P-Erk staining. Dashed white line, embryo margin. (C) Scatter plot showing nuclear staining intensity of P-Smad2 and P-Erk for a single 5-hpf embryo. Cells colored by nuclear staining intensity for sox32. (D) Plot showing P-Smad2 staining intensity for all cells in cell tiers 1–2 compared to background (cell tiers 9–10). Means ± SD are shown. (E) Plot showing P-Smad2 staining intensity for all cells in cell tiers 1–2, sorted into sox32-positive and -negative cells. Means ± SD are shown. (F) Traces showing the proportion of cells that are sox32-positive for a given P-Smad2 staining intensity for cells in cell tiers 1–2 at different stages. The proportion of sox32-positive cells for a given level of P-Smad2 staining is based on all cells within a window of ± 5% of the total range of P-Smad2 staining intensities for that stage. (G) As in (E), but showing P-Erk staining intensity. Means ± SD are shown. (H) As in (G), but showing P-Erk staining intensity for cells with P-Smad2 staining elevated above background levels. Means ± SD are shown. (I) Traces showing the proportion of cells that are sox32-positive for a given P-Erk staining intensity for cells in cell tier 1–2 with elevated P-Smad2 staining (defined as in H) at different stages. Traces are as in (F). In (H and I), the 99th percentile of P-Smad2 staining intensity for the cells from the cell tiers 9–10 is used as a threshold to define elevated P-Smad2. (J) Scatter plot showing nuclear staining intensity of P-Smad2 and P-Erk for cells in cell tiers 1–2 through time. Color coding indicates the proportion of cells for the given signaling profile which are sox32 positive. The data are a re-analysis of the data presented in panels F and I. Analyses in this figure are based on the dataset in Figure 2E. See also Figure S3. Scale bars: 50 μm (A, B). ∗∗∗∗p < 0.0001. |
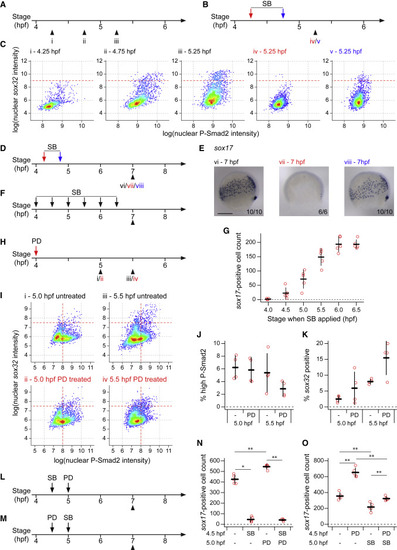
Endoderm progenitors require Nodal signaling for their induction but not maintenance (A–C) Schematics showing collection times of untreated embryos (A) and timings of SB-505124 (SB) application and embryo collection (B) for plots shown in (C). Colors of roman numerals correspond to the treatment (red and blue correspond to arrows in B, black to no SB). Density scatter plots showing nuclear intensity staining for P-Smad2 and sox32 for all cells in cell tiers 1–2 pooled from four embryos for each condition (C). Dashed red lines indicate threshold defining sox32-positive cells. (D and E) As in (B), but showing the timing of SB application and embryo collection for embryos in (E). Colors of roman numerals as in (A) and (B). Representative embryo following WISH for sox17 (E). Roman numerals refer to the schematics in (D). Dorsal to right; animal pole, top. Numbers in the bottom right refer to the number of embryos showing the phenotype out of the total number studied. (F) As in (B), but showing the timings of SB application and embryo collection for (G). (G) Quantification of sox17-positive cell numbers for embryos treated with SB as in (F). Means from five embryos per condition ± SD shown. For comparison, note that for DMSO-treated embryos the mean cell count is 260.8 and the SD, 18.14. (H) As in (B), but showing the timing of PD-0325901 (PD) application and embryo collection for (I). Roman numerals in red indicates PD treatment. (I) As in (C), but Roman numerals correspond to treatments as defined in (H). Horizontal dashed red lines indicate threshold defining sox32-positive cells. (J) Plot showing the percentage of cells in (I) with high P-Smad2 (as defined by vertical dashed red lines in (I)) for each treatment condition. Means ± SD are shown. (K) As in (J), but showing the percentage of high P-Smad2 cells in (I) which are sox32-positive (as defined by horizontal dashed red lines in I) for each treatment condition. Means ± SD are shown. (L and M) As in (B), but showing the timings of treatment with SB and PD and embryo collection for plots in (N and O). (N and O) Quantification of sox17-positive cells number for embryos treated with SB and PD as defined in (L) and (M), respectively. Means ± SD are shown. See also Figure S4. Scale bars: 250 μm (E). ∗p < 0.05; ∗∗p < 0.01 |
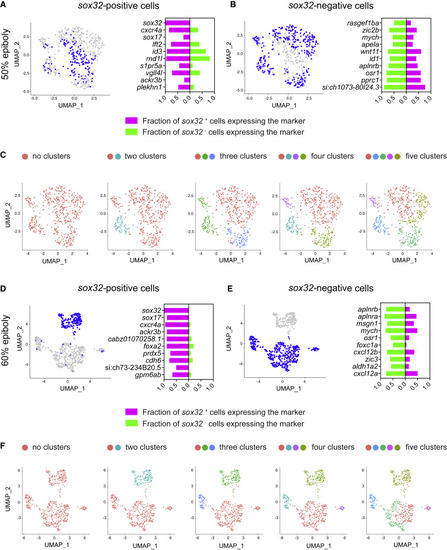
Switching to an endodermal fate is not associated with suppression of mesodermal fate (A) Left: uniform manifold approximation and projection (UMAP) visualization of gata5-positive cells derived from 50% epiboly stage embryos. Blue cells are those expressing at least one read count for sox32. Right: stacked bar plot showing the pct (percentage of expressing cells) for the top 10 genes differentially expressed in sox32-positive cells (magenta) compared to the pct for the same genes in sox32-negative cells (green). (B) Left: as in (A), but blue cells are those expressing less than one read count for sox32. Right: stacked bar plot showing the pct for the top 10 genes differentially expressed in sox32-negative cells (green) compared to the pct for the same genes in sox32-positive cells (magenta). (C) UMAP visualization of gata5-positive cells at 50% epiboly. Cells were clustered with increasing granularity across five iterations, Find cluster resolution = 0.1 to 0.5. Color coding refers to the different clusters. (D) As in (A), but for 60% epiboly embryos. (E) As in (B), but for 60% epiboly embryos. (F) As in (C), but for 60% epiboly embryos, Find cluster resolution = 0.01 to 0.5. See also Figures S5 and S6. |
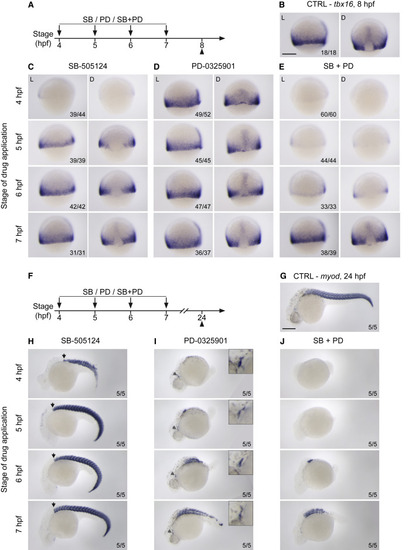
Nodal and Fgf signaling are required for mesoderm induction (A–E) WISH showing lateral (L) and dorsal views (D) of 8-hpf epiboly embryos stained for tbx16. Embryos underwent a time series of drug treatments with either 50 μM SB-505124 (left), 5 μM PD-0325901 (middle) or the combination of the two (right). Drug treatments were started at either 4 hpf, 5 hpf, 6 hpf, or 7 hpf, and embryos were fixed at 8 hpf epiboly (A). 8-hpf epiboly control (CTRL) embryos are shown for comparison (B). Note that for embryos treated from sphere stage with SB-505124 or the combination of SB-505124 and PD-0325901 the dorsal side cannot be unequivocally identified, as early Nodal inhibition prevents both tbx16 expression and the formation of the dorsal shield. Therefore, for these samples, side views of representative embryos are shown. (F–J) As in (A–E), but embryos were fixed at 24 hpf and stained for myod. 24-hpf CTRL embryos shown for comparison (G). In this case, all views are lateral. In (H), the black arrow marks the most anterior position of the somites. In (I), the gray arrow indicates the jaw muscle (shown magnified, top right). Numbers in the bottom right of the images refer to the number of embryos showing the phenotype out of the total number studied. Scale bars: 250 μm (B–G). |
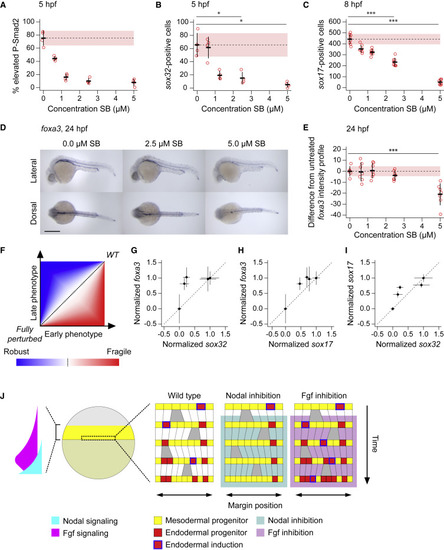
Endoderm induction is robust to variation in initial progenitor number (A) Plot showing percentage of cells in cell tiers 1 and 2 with elevated staining intensity for P-Smad2,for 5-hpf embryos treated at 4 hpf with different doses of SB-505124. Elevated P-Smad2 is defined by the mean background level for all embryos, with background for each embryo defined by the 99th percentile in P-Smad2 staining intensity for cell tiers 9 and 10. Four embryos per dose. Means ± SD are shown. (B) Number of sox32-positive cells for the same embryos as in (A). Means ± SD are shown. (C) Number of sox17-positive cells for 8-hpf embryos treated at 4 hpf with different doses of SB-505124. Eight embryos per dose. Means ± SD are shown. (D) Representative 24-hpf embryos showing foxa3 expression on treatment with different doses of SB-505124 in dorsal and lateral views. Anterior to left; in lateral view dorsal is up. (E) Quantification of the deviation of the foxa3 staining intensity profile from the mean untreated, for 24-hpf embryos treated at 4 hpf with different doses of SB-505124. Means ± SD are shown. Note that in A–C and E, dashed line denotes untreated mean, with pink shaded area as one SD. (F) Schematic illustrating robustness and fragility in developmental systems, through plotting developmental states of embryos at early versus late time points under a range of perturbation from wild type (WT) to fully perturbed. The blue region, where the deviation from WT is greater at early stages under a given strength perturbation (relative to fully perturbed case), represents robustness, while the red area where the converse is true, represents fragility. (G–I) Comparison of early endoderm development with later measures using quantifications in (B, C, and E) to identify robustness in development as described in (F). Comparison of sox32 counts at 5 hpf with foxa3 expression profiles at 24 hpf (G). Comparison of sox17 counts at 8 hpf with foxa3 expression profiles at 24 hpf (H). Comparison of sox32 counts at 5 hpf with sox17 counts at 8 hpf (I). (J) Model of endoderm progenitor specification in early zebrafish development. The Nodal and Fgf gradients at the margin are schematized3. For details, see text. See also Figure S7. Scale bars: 250 μm (D). ∗p < 0.05; ∗∗∗p < 0.001 |
Reprinted from Developmental Cell, 57, Economou, A.D., Guglielmi, L., East, P., Hill, C.S., Nodal signaling establishes a competency window for stochastic cell fate switching, 26042622.e52604-2622.e5, Copyright (2022) with permission from Elsevier. Full text @ Dev. Cell