FIGURE
Figure 5
- ID
- ZDB-FIG-230416-93
- Publication
- Rolland et al., 2023 - Prolonged Piezo1 Activation Induces Cardiac Arrhythmia
- Other Figures
- All Figure Page
- Back to All Figure Page
Figure 5
|
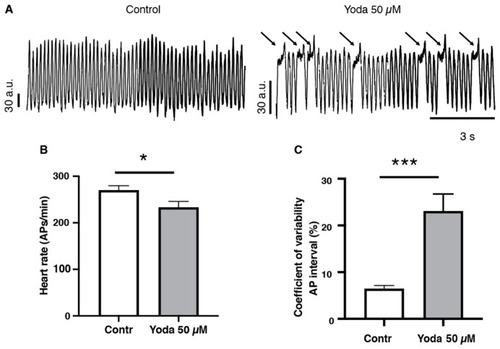
Optical mapping recordings of Yoda1-treated larvae. (A) Traces of optical action potentials recorded in the ventricular region of the larvae’s hearts, in control (DMSO) or after prolonged exposure to Yoda (50 µM). Arrows indicated prolonged ventricular depolarization. (B) Heart rate (ventricular action potentials per minute) and (C) coefficient of variability of the action potential interval in control (DMSO) and after prolonged exposure to Yoda 50 µM (n = 19 and 23, respectively). *: p < 0.05 and ***: p < 0.001 by unpaired t-test. |
Expression Data
Expression Detail
Antibody Labeling
Phenotype Data
Phenotype Detail
Acknowledgments
This image is the copyrighted work of the attributed author or publisher, and
ZFIN has permission only to display this image to its users.
Additional permissions should be obtained from the applicable author or publisher of the image.
Full text @ Int. J. Mol. Sci.

