
Figure 9.
- ID
- ZDB-FIG-230410-32
- Publication
- Zhou et al., 2023 - Assessment of Nonalcoholic Fatty Liver Disease Symptoms and Gut-Liver Axis Status in Zebrafish after Exposure to Polystyrene Microplastics and Oxytetracycline, Alone and in Combination
- Other Figures
- All Figure Page
- Back to All Figure Page
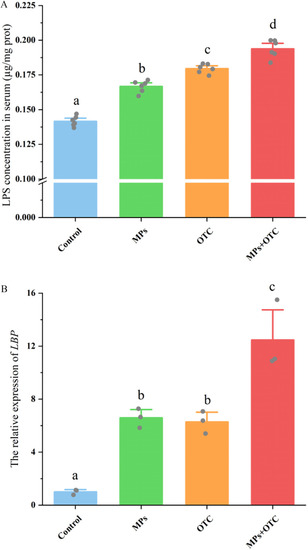
(A) LPS contents in serum (n=6 for each experimental group) and (B) expression levels of LBP in the livers (n=3 for each experimental group of zebrafish after 28-d exposure to control, MPs, OTC, and MP-OTC, respectively). The LPS content in the sample was measured with the commercial LPS ELISA kit (JL13861; Jonln Biotechnology) using a microplate reader (Multiskan GO; Thermo Scientific), and LBP expression was determined by real-time PCR with a Bio-Rad real-time system (CFX96; Bio-Rad). The corresponding numeric data are provided in Table S12. Data (means±SEs) with different superscripts above were significantly different at p<0.05 (one-way analysis of variance and Tukey’s post hoc tests). Note: ELISA, enzyme-linked immunosorbent assay; LBP, gene encoding lipopolysaccharide binding receptor; LPS, lipopolysaccharide; MP-OTC, microplastics and oxytetracycline; MPs, microplastics; OTC, oxytetracycline; PCR, polymerase chain reaction; prot, protein; SE, standard error. |