
Figure 7.
- ID
- ZDB-FIG-230410-30
- Publication
- Zhou et al., 2023 - Assessment of Nonalcoholic Fatty Liver Disease Symptoms and Gut-Liver Axis Status in Zebrafish after Exposure to Polystyrene Microplastics and Oxytetracycline, Alone and in Combination
- Other Figures
- All Figure Page
- Back to All Figure Page
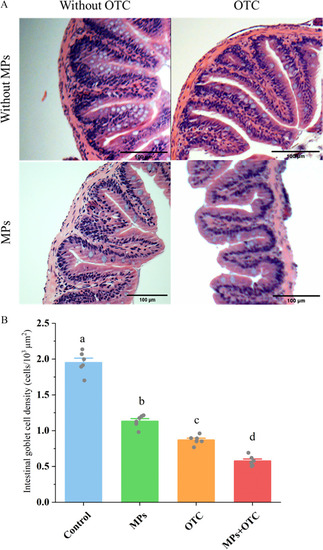
(A) Histological images of intestines and (B) quantified intestinal goblet cell densities in zebrafish exposed to control, MPs, OTC, and MP-OTC, respectively [n=6 for both analysis for each experimental group, and randomly selected images are presented as representatives for (A)]. The images of intestines presented in (A) were stained with H&E. The magnification and scale bar were 200× and 100μm for (A), respectively. Goblet cells are indicated by black arrows in (A). The corresponding numeric data for (B) are provided in Table S10. Data (means±SEs) with different superscripts above were significantly different at p<0.05 (one-way analysis of variance and Tukey’s post hoc tests). Note: H&E, hematoxylin and eosin; MP-OTC, microplastics and oxytetracycline; MPs, microplastics; OTC, oxytetracycline; SE, standard error. |