
FIGURE
Fig. 4
- ID
- ZDB-FIG-230404-23
- Publication
- Kossack et al., 2022 - Environmentally relevant uptake, elimination, and metabolic changes following early embryonic exposure to 2,3,7,8-tetrachlorodibenzo-p-dioxin in zebrafish
- Other Figures
- All Figure Page
- Back to All Figure Page
Fig. 4
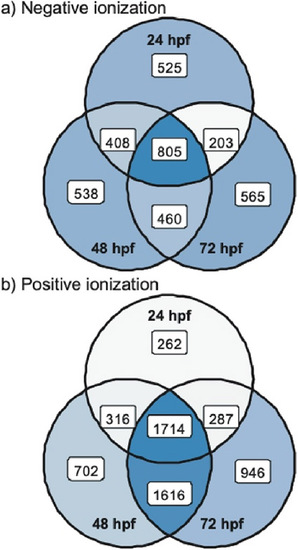
Venn diagram displaying the overlap of significant features in each ionization mode. Depicted are the total number of features determined to be significant (FDR>20%) in negative (A) and positive (B) ionization. The overlap represents features that were significant at multiple time points (24, 48, and/or 72 hpf). The number in the white box represents the total number of significant features found in samples at the labeled time point. |
Expression Data
Expression Detail
Antibody Labeling
Phenotype Data
Phenotype Detail
Acknowledgments
This image is the copyrighted work of the attributed author or publisher, and
ZFIN has permission only to display this image to its users.
Additional permissions should be obtained from the applicable author or publisher of the image.
Full text @ Chemosphere