
FIGURE
Fig. 2
- ID
- ZDB-FIG-230404-21
- Publication
- Kossack et al., 2022 - Environmentally relevant uptake, elimination, and metabolic changes following early embryonic exposure to 2,3,7,8-tetrachlorodibenzo-p-dioxin in zebrafish
- Other Figures
- All Figure Page
- Back to All Figure Page
Fig. 2
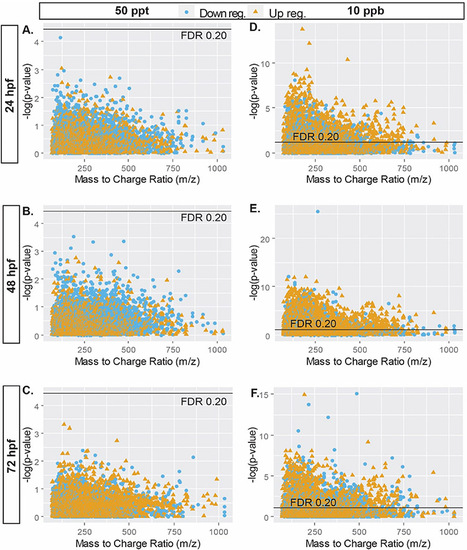
Manhattan plots of the negative ionization mode log10 transformed p-values describing the association between m/z features and the 50 ppt (A, B, & C)) and 10 ppb (D, E, & F) TCDD exposures at 24, 48, and 72 hpf. Blue circles represent features that were downregulated in comparsion to the control group, whereas orange triangles represent features that were upregulated . The black line indicates the p-value corresponding to a false discovery rate (FDR) threshold of 0.2. |
Expression Data
Expression Detail
Antibody Labeling
Phenotype Data
Phenotype Detail
Acknowledgments
This image is the copyrighted work of the attributed author or publisher, and
ZFIN has permission only to display this image to its users.
Additional permissions should be obtained from the applicable author or publisher of the image.
Full text @ Chemosphere