
- Title
-
Environmentally relevant uptake, elimination, and metabolic changes following early embryonic exposure to 2,3,7,8-tetrachlorodibenzo-p-dioxin in zebrafish
- Authors
- Kossack, M.E., Manz, K.E., Martin, N.R., Pennell, K.D., Plavicki, J.
- Source
- Full text @ Chemosphere
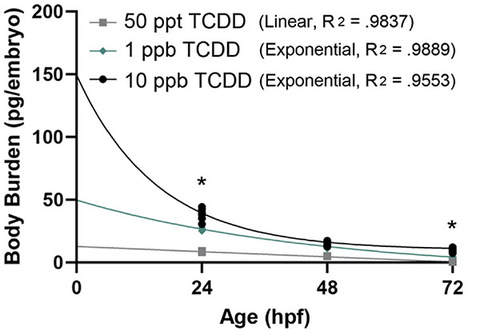
Change in embryonic TCDD concentration over time. Zebrafish were exposed to either a 50 ppt (grey boxes), 1 ppb (green dimonds), or 10 ppb (black circles) solution of TCDD for 1 hour at 4 h post-fertilization (hpf). Samples were fixed at 24, 48, and 72 hpf and TCDD was quantified at each time point. The 10 ppb and 1 ppb exposures were best modeled by exponential decay while the 50 ppt was best described by linear elimination. The asterisk (*) denotes a statistically significant difference between the 10 ppb and 1 pbb exposure groups (t-test). At 24 and 72 hpf, there was significantly more TCDD present per embryo in the 10 ppb exposure group (p = 0.1167 and p = 0.0001) when compared to the 1 ppb exposure group. |
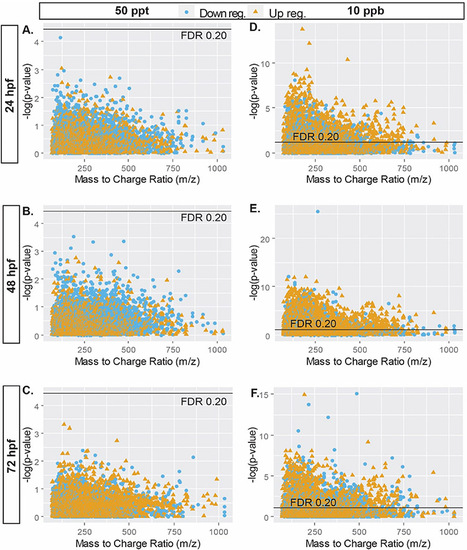
Manhattan plots of the negative ionization mode log10 transformed p-values describing the association between m/z features and the 50 ppt (A, B, & C)) and 10 ppb (D, E, & F) TCDD exposures at 24, 48, and 72 hpf. Blue circles represent features that were downregulated in comparsion to the control group, whereas orange triangles represent features that were upregulated . The black line indicates the p-value corresponding to a false discovery rate (FDR) threshold of 0.2. |
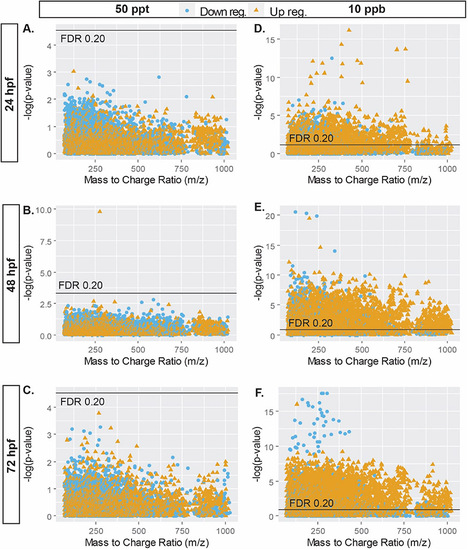
Manhattan plots of positivelog10 transformed p-values describing the association between m/z features and the 50 ppt TCDD exposure (A, B, & C) as well as the 10 ppb TCDD exposure (D, E, & F) at 24, 48, and 72 hpf. . Blue circles represent features that were downregulated in comparsion to the control group, whereas orange triangles represent features that were upregulated . The black line indicates the p-value corresponding to a false discovery rate (FDR) threshold of 0.2. |
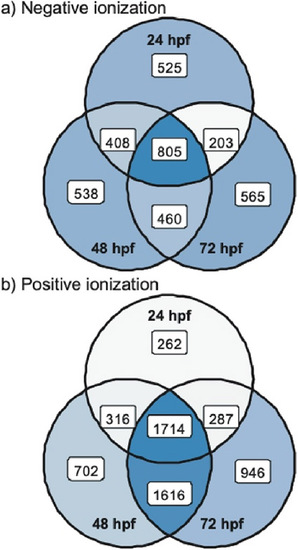
Venn diagram displaying the overlap of significant features in each ionization mode. Depicted are the total number of features determined to be significant (FDR>20%) in negative (A) and positive (B) ionization. The overlap represents features that were significant at multiple time points (24, 48, and/or 72 hpf). The number in the white box represents the total number of significant features found in samples at the labeled time point. |

Enriched pathways associated with the 10 ppb TCDD exposure group. Results are shown for pathways that had at least 5 significant metabolites in both the negative and positive ionization mode . The size of the dot represents the number of overlapping metabolites in the pathway. The position of the dot is determined by the -log p-value obtained from 10,000 permutations. The black vertical line indicates significance |