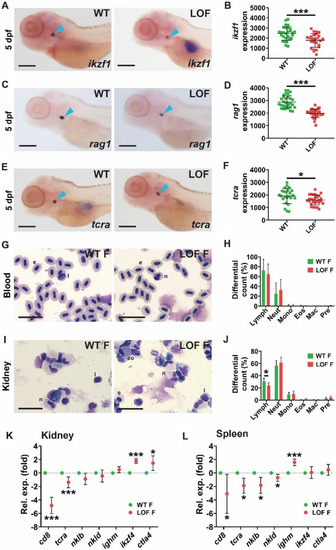
Effect of LOF Stat5.1 mutation on lymphoid cells. A–F Assessment of early lymphopoiesis in 5 dpf homozygous stat5.1wt/wt wild-type (WT) and stat5.1mdu022/mdu022 loss-of-function (LOF) mutant embryos using WISH analysis, presenting representative individuals for ikzf1(A), rag1(C) and tcra(E), along with quantification of the relative area of expression for ikzf1(B), rag1(D) and tcra(F), showing results for individual embryos along with mean ± SD and statistical significance (n = 25–31). Scale bar = 200 μm. G–J. Analysis of blood and immune cells in adults, presenting images of representative Giemsa-stained blood (G) and kidney marrow (I) smears from 5 month post-fertilisation WT and LOF female fish and quantification of indicated cell populations in blood (H) and kidney marrow (J) showing mean and SD with statistical significance indicated (n = 6). Scale bar = 20 μm. K–L Expression analysis of immune genes in adults using qRT2-PCR on kidney marrow (K) and spleen (L) samples from 5 month post-fertilisation WT and LOF female fish. Data for the indicated genes were normalised to actb and represented as relative fold-change compared to WT fish, with mean ± SD shown and statistical significance indicated (n = 6)
|
