
Fig. 5
- ID
- ZDB-FIG-230318-23
- Publication
- Wu et al., 2021 - A sensitive GRAB sensor for detecting extracellular ATP in vitro and in vivo
- Other Figures
- All Figure Page
- Back to All Figure Page
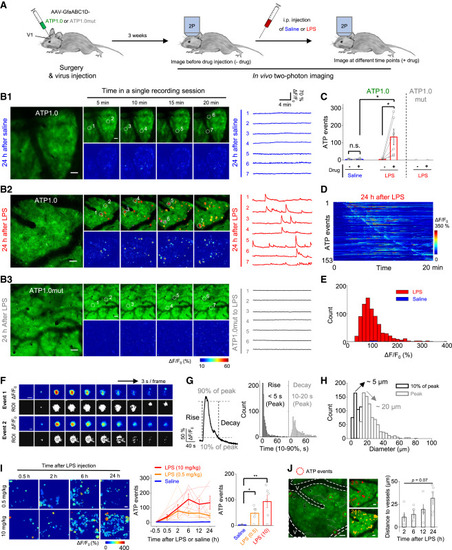
Figure 5. GRABATP1.0 reveals localized ATP-release events in mouse brain following LPS-induced systemic inflammation (A) Schematic diagram depicting the experimental protocol in which an AAV encoding either ATP1.0 or ATP1.0mut under the control of the GfaABC1D promoter is injected into the mouse visual cortex (V1), followed by two-photon imaging (2P) through a cranial window at various times after an intraperitoneal (i.p.) injection of saline or lipopolysaccharides (LPS). (B1 and B2) Representative fluorescence images, pseudocolor images, and individual traces of the fluorescence response of ATP1.0 measured 24 h after saline (B1) or 10 mg/kg LPS (B2) injection. Indicated regions of interest (ROIs, white dashed circles) are identified using AQuA software overlay. (B3) Same as (B2), except the ATP1.0mut sensor is expressed. (C) Summary of the number of localized ATP events measured during a 20 min recording before (−) and after (+) saline or 10 mg/kg LPS injection; n = 5 or 6 mice each. (D) Pseudocolor images showing all the identified ATP events in an exemplar ATP1.0-expressing mice after 24 h LPS injection. The number of identified ATP events from one mouse is shown on the y axis. (E) Distribution of the peak fluorescence response (ΔF/F0) of the localized ATP events measured in ATP1.0-expressing mice 24 h after 10 mg/kg LPS (red) or saline (blue) injection; n = 805 events from six mice and 25 events from five mice, respectively. (F) Detailed analysis of the properties of two individual localized ATP events shown as pseudocolor images of ΔF/F0 and the corresponding ROIs identified using AQuA software at 3 s intervals. (G) Left: a representative trace (averaged from 50 peak-aligned events) showing the rise and decay kinetics of the event, defined the time between 10% and 90% of the baseline to peak. Right: summary of rise and decay times; n = 805 events from six mice. (H) Distribution of the size of individual events at 10% of peak response (black) and peak response (gray) measured in ATP1.0-expressing mice 24 h after 10 mg/kg LPS injection; n = 805 events from six mice. (I) Left: representative images showing ATP-release events (indicated as ROIs) in ATP1.0-expressing mice at the indicated times after 0.5 and 10 mg/kg LPS injection. Middle and right: summary of the number of ATP-release events after 0.5 mg/kg LPS, 10 mg/kg LPS, or saline injection. The data from each individual mouse and the average data are shown. n = 6, n = 6, and n = 5 mice for the 0.5 mg/kg LPS, 10 mg/kg LPS, and saline groups, respectively. (J) Left: representative image showing early ATP-release events red dashed circles) located near the blood vessel (V, indicated by white dashed lines). Middle, images taken 2 h (red) and 24 h (yellow) after 10 mg/kg LPS injection. Right: summary of the distance between the events and the blood vessel at the indicated times after 10 mg/kg LPS injection; n = 5 mice. Scale bars represent 50 μm (B, I, and J) and 5 μm (F). Summary data are presented as mean ± SEM. The data in (C) were analyzed using Student’s t test; the data in (J) were analyzed using one-way ANOVA followed by Dunnett’s post hoc test; ∗p < 0.05; ∗∗p < 0.01; n.s., not significant. See also Figure S5 and Video S2. |