
Fig. 3
- ID
- ZDB-FIG-230318-21
- Publication
- Wu et al., 2021 - A sensitive GRAB sensor for detecting extracellular ATP in vitro and in vivo
- Other Figures
- All Figure Page
- Back to All Figure Page
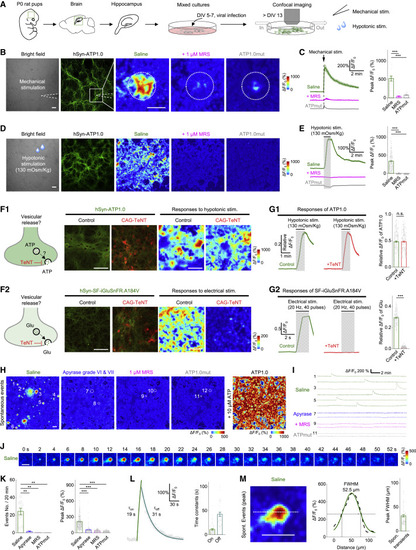
Figure 3. GRABATP1.0 can be used to detect ATP release in primary hippocampal cultures (A) Schematic diagram depicting the experimental protocol in which primary hippocampal neurons are cultured and infected with an AAV encoding ATP1.0 or ATP1.0mut under the control of the hSyn promoter, followed by confocal fluorescence microscopy during various stimuli. DIV, days in vitro. (B–E) Bright-field images, GFP fluorescence images, pseudocolor images (B and D), and average traces (C and E, left) of the fluorescence response of ATP1.0 or ATP1.0mut measured in saline or 1 μM MRS-2500 (MRS). The white dashed circles in (B) indicate the 150-μm-diameter ROI used for analysis, and the white dashed lines in (B) indicate the location of the electrode used for mechanical stimulation. The summary data (C and E, right) represent 13–20 ROIs from three coverslips (C) and 168–214 ROIs from three or four coverslips (E). (F1 and G1) Fluorescence images of ATP1.0 (green) and EBFP2-iP2A-TeNT (red) (F1), pseudocolor images (F1), average traces (G1, left), and summary data (G1, right); n = 217–227 ROIs from four coverslips each. (F2 and G2) Fluorescence images of SF-iGluSnFR.A184V (green) and TeNT-BFP2 (red) (F2), pseudocolor images (F2), average traces (G2, left panels), and summary data (G2, right); n = 171 ROIs from three coverslips each. (H) Cumulative transient change in ATP1.0 or ATP1.0mut fluorescence measured during 20 min of recording in saline, apyrase (15 U/mL VI plus 15 U/mL VII), or 1 μM MRS-2500. The white dashed circles indicate the ROIs used for the analyses in (I). (I) Representative traces of ΔF/F0 measured under the indicated conditions. (J) Representative time-lapse pseudocolor images captured in saline. (K) Quantification of the number of events per 20 min (left) and the peak fluorescence response (right) in neurons expressing ATP1.0 or ATP1.0mut; n = 114–363 ROIs from three to ten coverslips. (L and M) Kinetics profile (L) and spatial profile (M) of the change in ATP1.0 fluorescence measured in saline. The summary in (L) and (M) data represent 54 events and 128 events, respectively, from four coverslips. FWHM, full width at half maximum. Scale bars represent 100 μm. Summary data are presented as the mean ± SEM. The data in (C) and (E) were analyzed using one-way ANOVA followed by Dunnett’s post hoc test; the data in (G) were analyzed using Student’s t test; the data in (K) were analyzed using one-way ANOVA followed by Bonferroni’s multiple-comparison test. ∗∗p < 0.01 and ∗∗∗p < 0.001; n.s., not significant. See also Figure S7. |