
Fig 3
- ID
- ZDB-FIG-230315-53
- Publication
- Xie et al., 2023 - Ependymal polarity defects coupled with disorganized ciliary beating drive abnormal cerebrospinal fluid flow and spine curvature in zebrafish
- Other Figures
- All Figure Page
- Back to All Figure Page
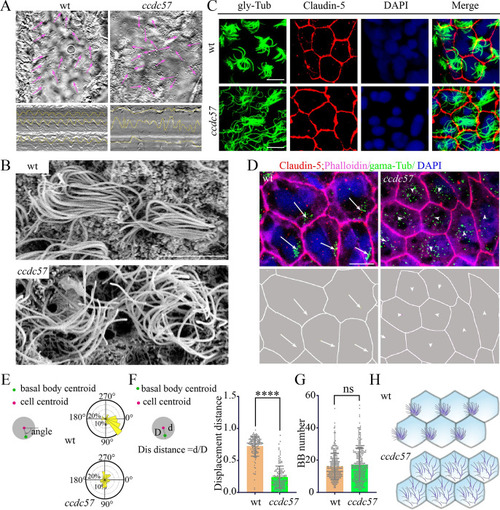
Mutation of ccdc57 results in planar polarity defects in ependymal cells.
(A) Still images showing the beating direction of motile cilia to drive fluid flow (pink arrow) in adult wild type and mutants. The representative kymographs of cilia movement were shown at the bottom. (B) Scanning electron microscopy showing the multicilia of the ependymal cells in wild type and ccdc57 mutant. (C) Confocal images showing cilia of the ependymal cells in wild type and ccdc57 mutant as indicated. Cilia were labeled with anti-mono-glycylated tubulin in green and the tight junction were stained with Claudin-5 antibody in red. Nuclei were counterstained with DAPI. (D) Confocal images showing the basal body distribution in the ependymal cells of wild type and ccdc57 mutant as indicated. The basal bodies were labeled with anti-γ tubulin in green and cytoskeleton was stained with phalloidin in purple. Tight junctions were stained with Claudin-5 antibody in red. Nuclei were counterstained with DAPI. Arrows indicate the displacement of basal bodies from the center of the cells. The schematic diagram of the displacement of basal bodies were shown at the bottom. (E) Angular distribution of the basal bodies in ependymal cells from wild type and ccdc57 mutant. (F) Statistical analysis showing relative displacement distance of basal bodies from center of the cell. (G) Statistical analysis showing the number of basal bodies in each ependymal cell of wild type and ccdc57 mutant. BB, basal body. (H) Model illustrating the distribution of multicilia on ependymal cells of wild type and ccdc57 mutant. All the data analyzed in this figure are generated from 3- to 4-months-old adult zebrafish. Scale bars: 5 μm in panels B and D; 7.5 μm in panel C. The data underlying the graphs shown in the figure can be found in S1 Data. |
| Antibodies: | |
|---|---|
| Fish: | |
| Anatomical Terms: | |
| Stage: | Adult |
| Fish: | |
|---|---|
| Observed In: | |
| Stage: | Adult |