
Fig 2
- ID
- ZDB-FIG-230315-52
- Publication
- Xie et al., 2023 - Ependymal polarity defects coupled with disorganized ciliary beating drive abnormal cerebrospinal fluid flow and spine curvature in zebrafish
- Other Figures
- All Figure Page
- Back to All Figure Page
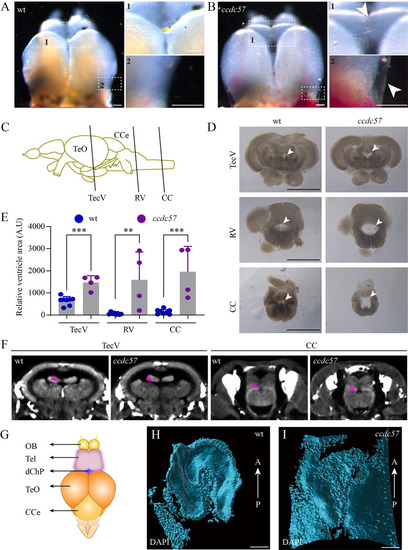
Hydrocephalus in ccdc57 mutants.
(A, B) External phenotypes of telencephalons in wild type and ccdc57 mutant. Arrows point to the expanded ependymal epithelia due to excess CSF accumulation. (C) Diagram of the brain tissue in zebrafish showing the sites of crossing section in different ventricles. CCe, corpus cerebelli; TeO, tectum opticum; CC, central canal; TecV, tectal ventricle; RV, rhombencephalic ventricle. (D) Histological cross-sections showing ventricles (arrows) at different sites as indicated. (E) Bar graph showing relative size of brain ventricles at different sites as indicated. (F) Micro-CT images showing the ventricles (arrows) in TecV and CC of wild type and mutant. (G) Diagram showing the position of diencephalic choroid plexus (dChP) in adult zebrafish. OB, olfactory bulb; Tel, telencephalon. (H, I) Three-dimensional reconstruction of dChP visualized with DAPI staining in wild type and ccdc57 mutant. These still images are from S1 Movie and visualized from ventral side of the dChP. A, anterior; P, posterior. Scale bars: 100 μm in panels A and B, 1 mm in panel D, and 50 μm in panels H and I. The data underlying the graphs shown in the figure can be found in S1 Data. |
| Fish: | |
|---|---|
| Observed In: | |
| Stage: | Adult |