|
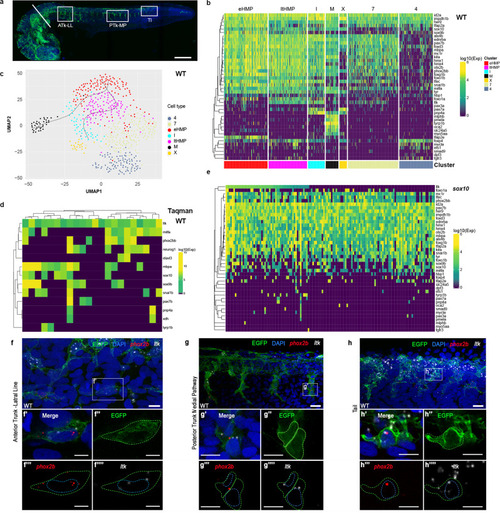
Highly multipotent, but not partially fate-restricted, intermediates are readily detected in zebrafish embryos. a Whole-mount immunodetection of EGFP in Tg(Sox10:Cre)ba74xTg(hsp70l:loxP-dsRed-loxP –Lyn-Egfptud107Tg showing source of single cells for NanoString profiling (24 hpf stage shown here; embryos at 30+ hpf had heads removed by severing behind otic vesicle (white bar). White boxes imaged in close-up in panels f–h to show anterior trunk lateral migration pathway and posterior lateral line nerve (ATk-LL), posterior trunk medial pathway (PTk-MP) and tail (Tl). b–e Single cell profiling of zebrafish NCCs reveals unexpected absence of partially-restricted pigment cell progenitors. b Heat maps showing NanoString profiles of clusters identified in c; see also Supplementary Fig. 3 for violin-plot representation. c NCC profile clustering, clustered and visualized in 2D by UMAP. Clusters are identified by distinctive expression profiles: eHMP (red), early highly multipotent progenitors; ltHMP (magenta), late highly multipotent progenitors; I (cyan), iridophores; X (gold), xanthophores; M (black), melanocytes; clusters marked with numbers not identified due to lack of distinctive marker gene profiles. Pseudotime trajectories to melanocyte and iridophore are indicated (see Supplementary Fig. 5) d Heat map showing independent qRT-PCR (Taqman assay) assessment of overlapping fate specification gene expression in 24 hpf WT embryos. Only cells with detectable ltk expression shown; for full profiles of all cells, see Supplementary Fig. 6. e Heat map of sox10 mutant cell NanoString transcriptional profiles, ordered by ltk expression levels. Due to low levels of ltk expression, cells with at least 5 gene counts are shown, instead of 30 in other panels. f–h, RNAscope expression analysis reveals co-expression of pigment cell and neuronal fate specification genes in vivo in 27 hpf Tg(Sox10:Cre)ba74xTg(hsp70l:loxP-dsRed-loxP–Lyn-Egfptud107Tg embryos after brief heat-shock to express EGFP. f, g, h, RNAscope FISH detection of phox2bb (red) and ltk (white) is shown in confocal lateral view projections of the lateral line (LL) in the anterior trunk (ATk; f), medial pathway (MP) in the posterior trunk (PTk; g) and tail (Tl; h). Insets (f’-h’) show co-expression of phox2bb and ltk in EGFP-labelled cells. Merge and individual channels for a single focal plane for each inset is shown in f’-h””. Yellow dashed line shows membrane cell border. Blue dashed line shows outline of nucleus for NCCs as revealed by DAPI (blue in merge). Scale bar dimensions: a =200 μm, g and h =20 μm, f, g'-g'''' and h'-h''''=10 μm, and f'-f'''' =5 μm.
|