
- Title
-
Zebrafish pigment cells develop directly from persistent highly multipotent progenitors
- Authors
- Subkhankulova, T., Camargo Sosa, K., Uroshlev, L.A., Nikaido, M., Shriever, N., Kasianov, A.S., Yang, X., Rodrigues, F.S.L.M., Carney, T.J., Bavister, G., Schwetlick, H., Dawes, J.H.P., Rocco, A., Makeev, V.J., Kelsh, R.N.
- Source
- Full text @ Nat. Commun.

Models show early NCCS (eNCCs) generating multipotent (MIX) and bipotent (MI) intermediates en route to generating melanocytes and iridophores, and distinguish timing of expression and role of Ltk signaling: a Ltk Chromatoblast Model b Ltk Iridoblast Model. In these schema, potency of cells (number of fill colours) at different stages in PFR of the pigment cell lineages decreases down the diagram (i.e. with time), reflecting PFR. Expression of ltk is indicated by italics (ltk); other key marker genes are indicated too. Ltk function (signaling activity) is indicated in Roman script (Ltk, boxed). Thus, in the Ltk Chromatoblast Model, ltk is expressed in all chromatoblasts (MIX) and melanoiridoblasts (MI)(‘Early’), but Ltk signaling is activated only in a subset of them, driving iridophore lineage specification (iridoblast specification). Continuing ltk expression in iridoblasts and iridophores (‘Late’) has late role in iridophore differentiation, proliferation and/or survival. In the Ltk Iridoblast Model, early phase expression represents iridoblasts (‘Early’), where it functions in differentiation or survival. Late expression reflects ongoing expression and ongoing function in differentiated iridophores. Experimental assessment using Ltk inhibitor treatment reveals early role in iridophore fate specification and later role in differentiated cells, supporting Ltk Chromatoblast Model (a) (Supplementary Fig. 9). |
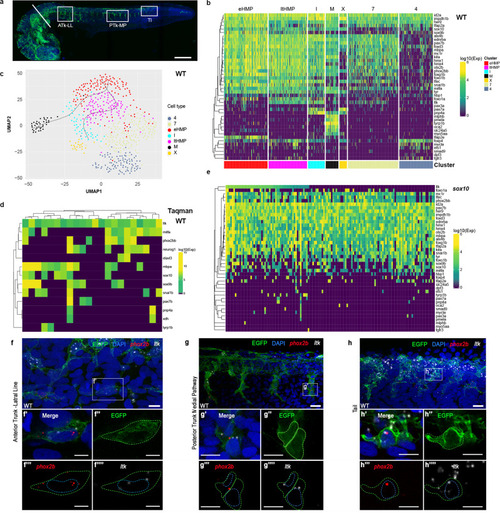
a Whole-mount immunodetection of EGFP in Tg(Sox10:Cre)ba74xTg(hsp70l:loxP-dsRed-loxP –Lyn-Egfptud107Tg showing source of single cells for NanoString profiling (24 hpf stage shown here; embryos at 30+ hpf had heads removed by severing behind otic vesicle (white bar). White boxes imaged in close-up in panels f–h to show anterior trunk lateral migration pathway and posterior lateral line nerve (ATk-LL), posterior trunk medial pathway (PTk-MP) and tail (Tl). b–e Single cell profiling of zebrafish NCCs reveals unexpected absence of partially-restricted pigment cell progenitors. b Heat maps showing NanoString profiles of clusters identified in c; see also Supplementary Fig. 3 for violin-plot representation. c NCC profile clustering, clustered and visualized in 2D by UMAP. Clusters are identified by distinctive expression profiles: eHMP (red), early highly multipotent progenitors; ltHMP (magenta), late highly multipotent progenitors; I (cyan), iridophores; X (gold), xanthophores; M (black), melanocytes; clusters marked with numbers not identified due to lack of distinctive marker gene profiles. Pseudotime trajectories to melanocyte and iridophore are indicated (see Supplementary Fig. 5) d Heat map showing independent qRT-PCR (Taqman assay) assessment of overlapping fate specification gene expression in 24 hpf WT embryos. Only cells with detectable ltk expression shown; for full profiles of all cells, see Supplementary Fig. 6. e Heat map of sox10 mutant cell NanoString transcriptional profiles, ordered by ltk expression levels. Due to low levels of ltk expression, cells with at least 5 gene counts are shown, instead of 30 in other panels. f–h, RNAscope expression analysis reveals co-expression of pigment cell and neuronal fate specification genes in vivo in 27 hpf Tg(Sox10:Cre)ba74xTg(hsp70l:loxP-dsRed-loxP–Lyn-Egfptud107Tg embryos after brief heat-shock to express EGFP. f, g, h, RNAscope FISH detection of phox2bb (red) and ltk (white) is shown in confocal lateral view projections of the lateral line (LL) in the anterior trunk (ATk; f), medial pathway (MP) in the posterior trunk (PTk; g) and tail (Tl; h). Insets (f’-h’) show co-expression of phox2bb and ltk in EGFP-labelled cells. Merge and individual channels for a single focal plane for each inset is shown in f’-h””. Yellow dashed line shows membrane cell border. Blue dashed line shows outline of nucleus for NCCs as revealed by DAPI (blue in merge). Scale bar dimensions: a =200 μm, g and h =20 μm, f, g'-g'''' and h'-h''''=10 μm, and f'-f'''' =5 μm. |
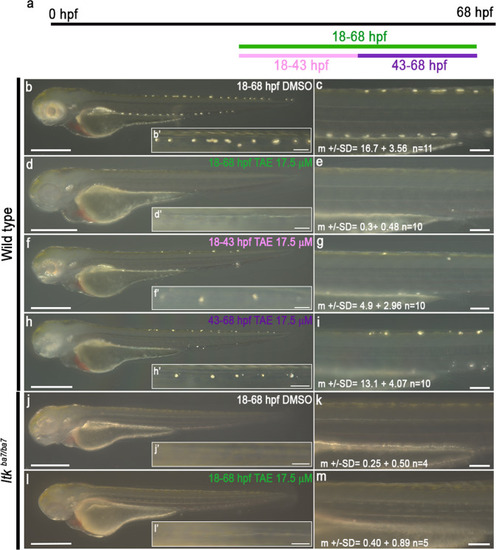
Schematic showing time window treatment (a). Embryos were treated with DMSO (b and c) or 17.5 μM TAE-684 (d–i) during defined time periods: 18-68 hpf (‘control’, b-c), 18-68 hpf (‘full’, d-e), 18-43 hpf (‘early’, f-g) and 43-68hpf (‘late’, h-i). Iridophores in the dorsal stripe were detected through their endogenous reflectivity; PTU-treatment from 24 hpf was used to suppress melanisation. Note how ‘early’ inhibition of Ltk reduces the number of iridophores (specification defect), whilst ‘late’ inhibition prevents the enlargement of iridophores (proliferation or differentiation). Homozygous ltk mutants (ltkba7/ba7) treated with DMSO (j and k) or 17.5 μM TAE-684 (l-m) during 18-68 hpf were indistinguishable, showing no more than occasional iridophores in the dorsal stripes, and similar to WT embryos treated in the same time window (d and e). All images were taken left side view with dorsal to the top. b–hn = 10 embryos on each condition; n = 3 independent experiments. jn = 4 embryos, ln = 5 embryos; n = 3 independent experiments. Source data are provided as a Source Data file. |
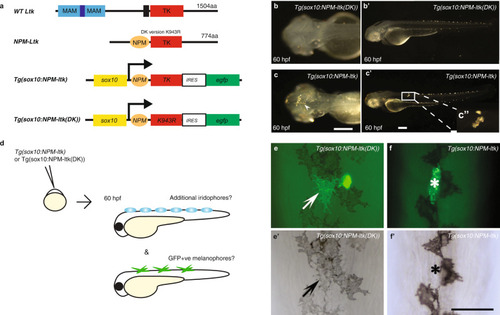
a, Schematic drawings of wild-type Ltk and NPM-Ltk fusion protein, and of NC expression construct Tg(sox10:NPM-ltk); see text for details of these and of negative control kinase dead construct, Tg(sox10:NPM-ltk(DK)). b-c’, Validation of constitutively-activated Ltk and dead kinase control. Embryos injected with sox10:NPM-ltk DK (b, b’) and Tg(sox10:NPM-ltk) (c, c’), imaged at 60 hpf. Precocious (arrowhead in c) and ectopic (inset c”) iridophores are shown. Melanisation was inhibited by PTU treatment to enhance detection of iridophores. b, c Dorsal views with anterior to the left. b’, c’ left side views with dorsal to the top. Scale bars: 100 µm. d-f ’, Ltk activity is inconsistent with melanocyte differentiation. d, Schematic drawing of experimental procedure. DNA constructs were injected into embryos at 1-cell stage. Embryos were cultured until 60 hpf, scored for precocious/ectopic iridophore formation, and subjected to anti-GFP antibody staining. e-f ’, GFP-positive melanophore in control embryos injected with Tg(sox10:NPM-ltk(DK)) (arrows in e, e’); a second GFP-positive cell was an iridophore based upon its position and shape. In embryos injected with Tg(sox10:NPM-ltk), GFP-positive cells were almost invariably not melanised (asterisks in f, f ’). All views show dorsal midline, anterior to the top. Panels e and f are fluorescent images merged with bright field images and |
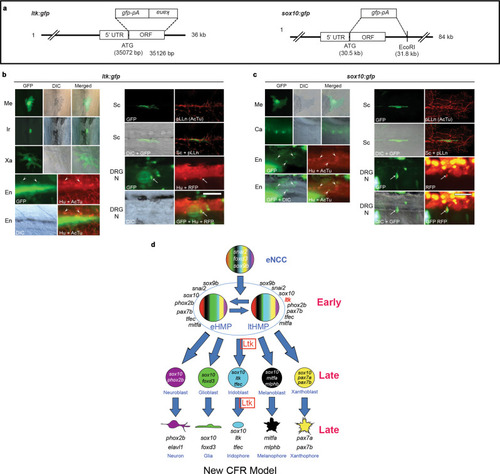
a Schematic drawings of reporters. In both constructs, gfp cDNA with polyA site (pA) is inserted at the site of the first methionine. See Methods for details. b Cells labeled by TgBAC(ltk:gfp), shown at 2 dpf (DRG neuron), 3 dpf (melanocyte) or 4 dpf (others). All pigment cells are labeled by GFP or anti-GFP antibody, and observed by differential interference contrast (DIC) and immunofluorescence (GFP) microscopy; combined DIC and fluorescent images also shown (merged). Schwann cell around the posterior lateral line nerve is also detected by anti-GFP antibody (GFP), and pLLn is detected by anti-acetylated tubulin antibody (AcTu). Enteric and DRG sensory neurons are labelled by GFP, with enteric neurons identified by position (revealed by Differential Interference Contrast (DIC)) and anti-Elavl1 staining (Hu)(arrowheads; anti-AcTu also detected), whilst DRGs are identified by position and anti-Elavl1 staining (Hu) and RFP driven by neurog1 promoter (arrows) (see Methods). DRG N, DRG neuron; En, enteric neuron; Ir, Iridophore; Me, melanocyte; pLLn, posterior lateral line nerve; Sc, Schwann cell; Xa, Xanthophore. c Cells labeled by TgPAC(sox10:gfp). In addition to pigment cells and Schwann cells, lower jaw cartilage (Ca), enteric neurons and DRG are also labeled. For quantitation, see Table 2. Scale bar: 50 µm for b and c. d Cyclical Fate Restriction model of pigment cell development. Pigment cells derive from Highly Multipotent Progenitor (HMP) cells, which are envisaged as cycling through multiple sub-states; for simplicity, only two of these (eHMP and ltHMP) are distinguished here, based principally upon the level of expression of ltk (see Fig. 2b). Early and late phase Ltk expression reflects that in the ltHMP and iridoblast/iridophore respectively, with Ltk function (Ltk, boxed) required early for specification of iridophore lineage from ltHMP and late for ongoing differentiation/proliferation. See Fig. 1 legend for key. |