
FIGURE
Figure 2
- ID
- ZDB-FIG-230228-131
- Publication
- Wesselman et al., 2023 - Estrogen Signaling Influences Nephron Segmentation of the Zebrafish Embryonic Kidney
- Other Figures
- All Figure Page
- Back to All Figure Page
Figure 2
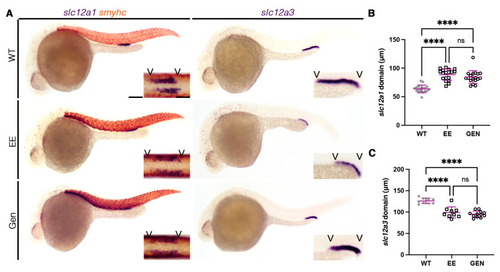
Xenoestrogens phenocopy E2 distal nephron segmentation phenotypes. (A) The 28 ss WT (top), 20 µM ethinylestradiol (EE, middle), or 20 µM genistein (GEN, bottom) treated animals stained via WISH for the DE marker (slc12a1) with the somite marker (smyhc) (left), or the DL marker (slc12a3) (right). Scale bar = 100 µm for lower magnification, scale bar = 50 µm for higher magnification. (B,C) DE and DL domain lengths at 28 ss in micrometers. Data presented on graphs are represented as mean ± SD. **** p < 0.0001 (ANOVA). |
Expression Data
Expression Detail
Antibody Labeling
Phenotype Data
Phenotype Detail
Acknowledgments
This image is the copyrighted work of the attributed author or publisher, and
ZFIN has permission only to display this image to its users.
Additional permissions should be obtained from the applicable author or publisher of the image.
Full text @ Cells