
Figure 1
- ID
- ZDB-FIG-230228-125
- Publication
- Wesselman et al., 2023 - Estrogen Signaling Influences Nephron Segmentation of the Zebrafish Embryonic Kidney
- Other Figures
- All Figure Page
- Back to All Figure Page
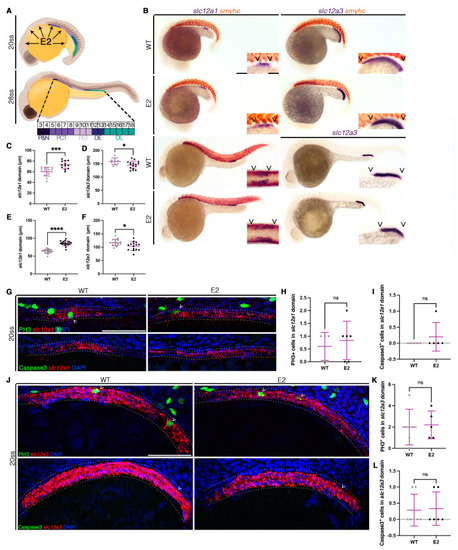
Exogenous E2 alters distal nephron segmentation independently of cell dynamics. (A) Schematic of nephrogenesis in a zebrafish from the early 20 ss (top) to the fully patterned 28 ss (bottom). 17β-estradiol (E2) is present in the yolk ball and diffuses to surrounding tissues. By 28 ss, the nephron is comprised of discrete segments with unique somite addresses: podocytes and neck (P&N, somites 3–4), proximal convoluted tubule (PCT, somites 5–8), proximal straight tubule (PST, somites 9–11), distal early (DE, somites 12–13), and distal late (DL, somites 14–18). (B) 20 ss (top two rows) and 28 ss (bottom two rows) WT control animals treated with DMSO as a vehicle control, and siblings treated with 20 µM of E2 from the shield stage to 24 hpf, stained via WISH for the DE marker (slc12a1, left) or the DL marker (slc12a3, right) with the somite marker (smyhc). Scale bar = 100 µm for lower magnification, scale bar = 50 µm for higher magnification. (C,D) DE and DL domain lengths at 20 ss in micrometers. (E,F) DE and DL domain lengths at 28 ss in micrometers. (G) The 20 ss WT (left) and 20 µM E2 (right) nephrons (outlined with dotted line) stained for the DE (slc12a1) via FISH and proliferating (PH3, top) or apoptotic (Caspase3, bottom) cells via immunofluorescence. Arrow heads denote double-positive cells. Scale bar = 50 µm. (H) Number of PH3-positive cells in the DE at the 20 ss. (I) Number of Caspase3-positive cells in the DE at the 20 ss. (J) The 20 ss WT (left) and 20 µM E2 (right) nephrons (outlined with dotted lines) stained for the DL (slc12a3) via FISH and proliferating (PH3, top) or apoptotic (Caspase3, bottom) cells via immunofluorescence. Arrow heads denote double-positive cells. Scale bar = 50 µm. (K) Number of PH3-positive cells in the DL at the 20 ss. (L) Number of Caspase3-positive cells in the DL at the 20 ss. Data presented on graphs are represented as mean ± SD. * p < 0.05, *** p < 0.001, and **** p < 0.0001 (t-test). |