
FIGURE
Fig. 3
- ID
- ZDB-FIG-230126-33
- Publication
- Giong et al., 2021 - Systematic expression profiling of neuropathy-related aminoacyl-tRNA synthetases in zebrafish during development
- Other Figures
- All Figure Page
- Back to All Figure Page
Fig. 3
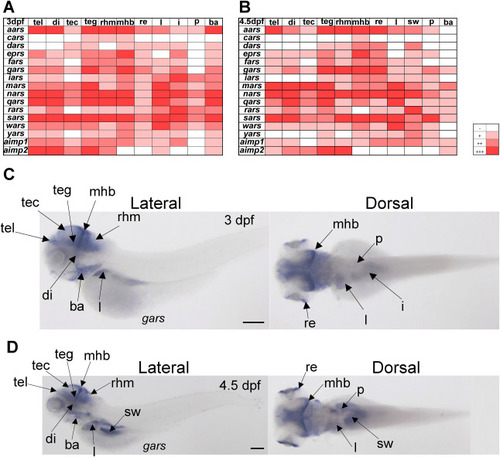
Fig. 3. An expression heatmap of 14 ars and 2 aimp genes at 3 and 4.5 dpf. (A, C) An expression heatmap for all 16 genes at 3 dpf (A) and 4.5 dpf (C). (B, D) gars expression as representative images at 3 dpf (B) and 4.5 dpf (D). Scale bar = 200 μm. (refer to the list of abbreviations for the name of tissues). |
Expression Data
| Gene: | |
|---|---|
| Fish: | |
| Anatomical Terms: | |
| Stage Range: | Protruding-mouth to Day 4 |
Expression Detail
Antibody Labeling
Phenotype Data
Phenotype Detail
Acknowledgments
This image is the copyrighted work of the attributed author or publisher, and
ZFIN has permission only to display this image to its users.
Additional permissions should be obtained from the applicable author or publisher of the image.
Full text @ Biochem. Biophys. Res. Commun.