
Fig. 6
- ID
- ZDB-FIG-230124-57
- Publication
- Megat et al., 2023 - Integrative genetic analysis illuminates ALS heritability and identifies risk genes
- Other Figures
- All Figure Page
- Back to All Figure Page
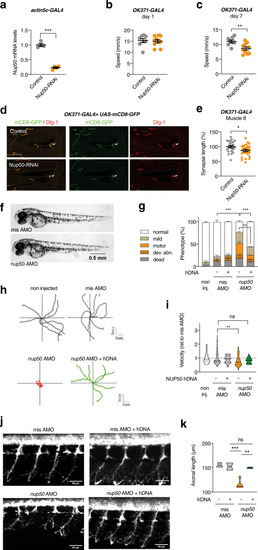
knockdown of Nup50 leads to motor defects in Drosophila and Zebrafish.
a Drosophila Nup50 mRNA expression level (% driver-only control) in third instar larvae ubiquitously (actin5C-GAL4) expressing Nup50-RNAi. n = 4 per genotype; ***p < 0.0001 by two tailed unpaired t test. Data are presented as mean values ± SEM b, c Climbing speed in automated negative geotaxis assay of 1- (b) or 7-day-old (c) male flies expressing Nup50-RNAi in motor neurons (OK371-GAL4). Independent groups of 10 flies: n = 8 (control); n = 10 (OK371-GAL4) **p = 0.0061 by unpaired two tailed t test. Data are presented as mean values ± SEM d Representative images of the NMJ on muscle 8 (white arrow) visualized by membrane GFP (UAS-mCD8-GFP) in motor neurons (OK371-GAL4) labeling axons and presynaptic compartment of NMJs (green), and dlg1 (postsynaptic compartment of NMJs, red) in third instar larvae expressing Nup50-RNAi in motor neurons (OK371-GAL4) compared to driver-only control. Scale bar: 100 μm. e Synapse length on distal muscle 8 of third instar larvae expressing Nup50-RNAi selectively in motor neurons (OK371-GAL4). n = 23–28 per genotype; *p < 0.05 by unpaired two-tailed t test. Data are presented as mean values ± SEM. f Representative images of 48 hpf zebrafish embryos showing no difference on global morphology. g Distribution of motor phenotypes of 48 hpf zebrafish embryos among the different conditions. Data are presented as mean +sem; **p < 0,01 and ****p < 0,0001 by Tukey’s multiple comparison test following 2way ANOVA. Number of independent embryos per condition: n = 82 non-injected, n = 56 misAMO, n = 53 misAMO+hDNA, n = 87 nup50 AMO, n = 54 nup50 AMO + hDNA in two different crossings. h, i Representative swimming trajectories of 48 hpf zebrafish embryos upon TEER test (h) and quantification (i). Each dot represents one embryo. Data normalized to mis AMO control are presented as violin plot. Solid line: median; dashed lines: quartiles. **p < 0,01 and non-significant (ns) by One-way ANOVA followed by Tukey’s multiple comparison test. n = 92 non injected, n = 83 misAMO, n = 24 misAMO+hDNA, n = 111 nup50 AMO, n = 19 nup50 AMO + hDNA. j, k: Representative images of spinal motor neurons of 48 hpf zebrafish embryos (j) and corresponding quantification. Data are presented as violin plot. Solid line: median; dashed lines: quartiles. **p < 0,01, ***p < 0.001 and non-significant (ns) by Tukey’s multiple comparison test following 1way ANOVA. n = 4 misAMO, n = 2 misAMO+hDNA, n = 4 nup50 AMO, n = 3 nup50 AMO + hDNA. |
| Gene: | |
|---|---|
| Fish: | |
| Knockdown Reagent: | |
| Anatomical Term: | |
| Stage: | Long-pec |
| Fish: | |
|---|---|
| Knockdown Reagent: | |
| Observed In: | |
| Stage: | Long-pec |