
- Title
-
Integrative genetic analysis illuminates ALS heritability and identifies risk genes
- Authors
- Megat, S., Mora, N., Sanogo, J., Roman, O., Catanese, A., Alami, N.O., Freischmidt, A., Mingaj, X., De Calbiac, H., Muratet, F., Dirrig-Grosch, S., Dieterle, S., Van Bakel, N., Müller, K., Sieverding, K., Weishaupt, J., Andersen, P.M., Weber, M., Neuwirth, C., Margelisch, M., Sommacal, A., Van Eijk, K.R., Veldink, J.H., Project Mine Als Sequencing Consortium, Lautrette, G., Couratier, P., Camuzat, A., Le Ber, I., Grassano, M., Chio, A., Boeckers, T., Ludolph, A.C., Roselli, F., Yilmazer-Hanke, D., Millecamps, S., Kabashi, E., Storkebaum, E., Sellier, C., Dupuis, L.
- Source
- Full text @ Nat. Commun.
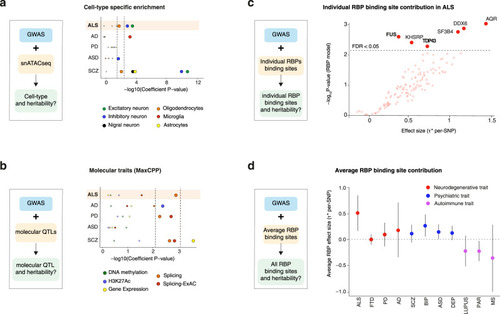
Cell type specific and molecular trait heritability of ALS.
a Strategy to characterize cell-type specific heritability through integration of GWAS with single nuclei ATACseq (snATACseq) data (left) and p-values for enrichment in cell-type specific heritability in considered diseases (right). Dots indicate two-sided −log10 (P-values) of enrichment obtained by linear regression model in LDSC analysis. Top dashed line indicates statistically significant enrichments after correction for multiple testing over all diseases (n = 5), cell types (n = 6) with Bonferroni correction p < 0.05. Bottom dashed lines indicated statistically significant enrichments after Benjamini–Hochberg multiple correction FDR < 0.05. Results indicate enrichment for inhibitory and excitatory neurons in ALS, but not in other neurodegenerative diseases. b Strategy to characterize molecular QTL-related heritability through integration of GWAS with QTLs data (left) and P-values for enrichment in heritability for 5 molecular traits in considered diseases (right). Dots indicate indicates two-sided −log10 (P-values) of enrichment obtained by linear regression model in LDSC analysis. Top dashed line indicates statistically significant enrichments after correction for multiple testing over all diseases (n = 5), molecular QTLs (n = 5) with Bonferroni correction p < 0.05. Bottom dashed lines indicated statistically significant enrichments after Benjamini–Hochberg multiple correction FDR < 0.05. Results indicate a global enrichment in sQTLs in ALS, PD and SCZ. Higher dashed lines indicate Bonferroni corrected p-values < 0.05 while lower dashed lines indicates FDR < 0.05. c Strategy to characterize individual RBP binding site heritability through integration of GWAS with RBP binding site data The per-SNP heritability effect sizes (τ*) for each RBP target site dysregulation is plotted for ALS GWAS. The dashed line indicates RBP models FDR < 0.05 threshold after multiple hypothesis correction (block jackknife-based one-sided p-values; Benjamini–Hochberg correction). d The per-SNP heritability effect sizes (τ*) for RBPs after conditioning on a collection of molecular QTL annotations (i.e. independent RBP effects from molecular QTLs and baseline annotations). Circle dots represent the mean of RBP effect size for each disease and error bars are 95% CI. ALS amyotrophic lateral sclerosis, FTD fronto-temporal dementia, PD Parkinson’s disease, AD Alzheimer’s disease, SCZ Schizophrenia, DEP depression, BIP bipolar disorder, ASD autism spectrum disorder, PAR rheumatoid arthritis, MS multiple sclerosis. |
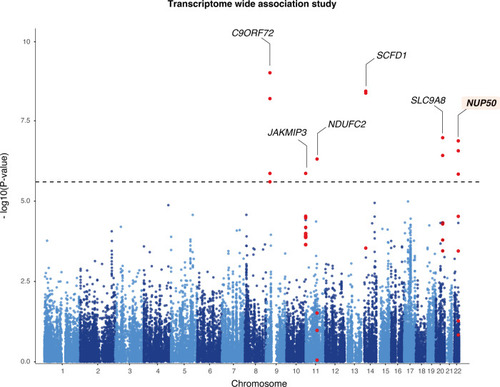
Transcriptome-wide association study of amyotrophic lateral sclerosis.
Manhattan plot of ALS transcriptome-wide association study (TWAS) using gene expression from the GTEx consortium brain tissues. The y-axis corresponds to two-tailed −log10 (P-values); the x-axis corresponds to genomic coordinates (GRCh37). The horizontal dashed line reflects the threshold for calling genome-wide significant genes (P = 5 × 10⁻⁶) after Bonferroni correction. |
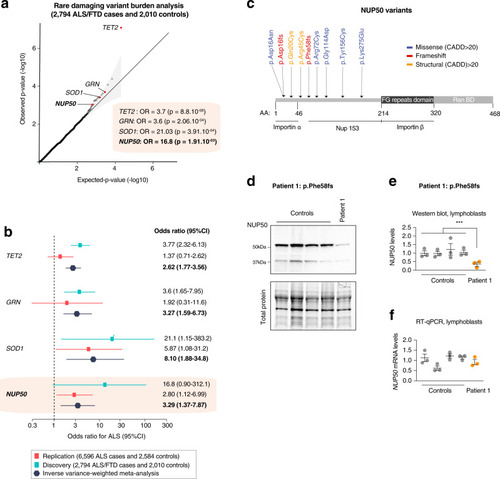
Rare variant burden analysis prioritizes NUP50.
a Rare damaging variants in the replication ALS dataset. The x- and y-axis represent the negative logarithm P value (–log(P); n = 2794 ALS/FTD cases, n = 2010 controls). Q–Q plot depicting on x-axis the −log 10 of expected p value versus the actually measured p values from firth logistic regression for 10,182 genes. Exome-wide correction for multiple testing was set at P < 2.5 × 10⁻⁶, Bonferroni p < 0.05. Genes in red are genome-wide significant. Genes in blue are ALS/FTD known genes and candidate gene NUP50 at suggestive p-value < 1 × 10⁻³. b Analysis of candidates and ALS genes only. Forest plot display per-cohort association in discovery (6596 cases and 2584 controls) and replication (2794 ALS/FTD cases and 2010 controls). OR values and 95% CI for each cohort and meta-analysis are depicted in different color. The graphs display the means and 95% confidence interval. c High confidence NUP50 variants with a CADD (combined annotation-dependent depletion) score >20 are indicated. Most of these variants are located in or near the importin alpha domain of the NUP50 protein suggesting a role in nucleo-cytoplasmic transport. d–f NUP50 expression analysis in lymphoblasts from n = 4 healthy donors and n = 1 patient carrying the NUP50 frameshift Phe58fs mutation. Data are presented as mean values ± SEM n = 3 biologically independent experiments, each performed in triplicate. The mean value of each biological replicate is indicated by a dot on the scatter plot in (e, f). Western blotting (b, c) shows a significant decrease in NUP50 protein levels (One way ANOVA: F(1,13) = 12.5, p = 0.00365, Control ~ Patient: post-hoc Tukey, adjusted-p = **0.00367). However, we observed no significant changes in NUP50 mRNA expression (d, Nested t test t = 0.20955, p = 0.8348). |
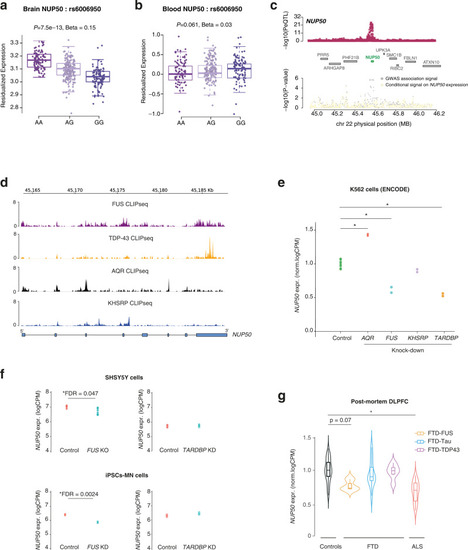
Genetics of NUP50 expression in ALS-FTD.
a, b Boxplot showing the association between a single-nucleotide polymorphism (SNP) (rs6006950) that tags the ALS genome-wide association studies (GWAS) risk loci at NUP50 and gene expression level of NUP50 in DLPFC (a) and blood from the GTEx consortium (b). Each dot represents an individual patient carrying the corresponding rs6006950 SNP allele combination. rs6006950 is significantly associated with the expression level of NUP50 in DLPFC, but not in blood. Linear regression between each genotype and residualized NUP50 expression generates p-values reported in (a) (beta = 0.15; p = 7.5 × 10⁻¹³) and (b) (beta = 0.02; p = 0.061). Boxplot shows median and quartile distributions, the upper and lower lines representing the 75th and 25th percentiles. c LocusZoom style plot for the region surrounding NUP50 shows colocalization of the DLPFC NUP50 expression quantitative loci (eQTL) (top panel) and ALS GWAS association signal (bottom). ALS TWAS signal at the NUP50 locus (gray) and TWAS signal after removing the effect of NUP50 expression (yellow). This analysis shows that the association is largely explained by NUP50 expression. d Intersection between the 6 RBPs associated with ALS and NUP50 genes coordinates identifies 4 RBP binding sites. Normalized CLIPseq tracks shows RNA-binding of 4 RBPs on the NUP50 gene. e Differential expression analysis of NUP50 mRNA in K562 cells (ENCODE consortium) upon AQR, FUS, TDP-43 and KHSRP knockdown. * indicates genome-wide significant changes at FDR < 0.05 (Source Data). f Differential expression analysis of NUP50 mRNA in neuronal cell lines SHSY5Y and iPSCs-derived motorneurons upon TARDBP and FUS knockdown. p-values were adjusted for multiple comparison FDR < 0.05. * indicated genome-wide significant changes in genes expression at FDR < 0.05. g Differential expression analysis of NUP50 mRNA of ALS-FTD patients in post-mortem DLPFC tissues. * indicates genome-wide significant change in gene expression at a FDR < 0.05. n = 23 controls, n = 3 FTD-FUS, n = 12 FTD-Tau, n = 6 FTD-TDP43 and n = 22 ALS. p-values were adjusted for multiple comparison FDR < 0.05. Boxplots show median and quartile distributions, the upper and lower lines representing the 75th and 25th percentiles. |
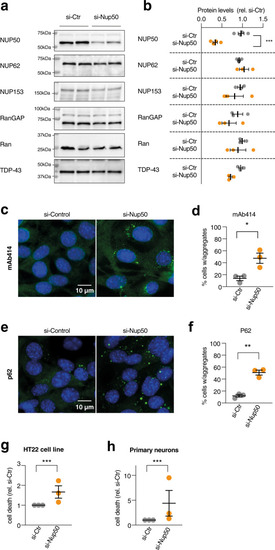
knockdown of NUP50 in mouse neuronal cells.
a Representative images of western blots for NUP50, different nucleoporins and TDP-43. Western blots were processed in parallel to avoid cross reaction of similar-sized proteins, and quantification of the studied protein was normalized with StainFree loading control for each gel, as provided in Source Data. n = 3 biologically independent experiments, each performed in duplicate. b Dot plots showing a decrease in NUP50 levels (Two-tailed Nested t test: t = 8124, df = 14, ****p < 0.0001) but not other associated nucleoporins, RanGAP or TDP-43 (p > 0.05) after knock-down of the Nup50 mRNA (si-Nup50) compared to the control condition. c, d Representative images and dot plots showing an increase in cytoplasmic inclusions of nucleoporins as stained with mAb414 recognizing the repeated FXFG repeat sequence in nucleoporins in HT22 cell line upon Nup50 knock-down (Two-tailed Nested t test: t = 6,778, df = 16,****p < 0.0001). e, f Representative images and dot plots showing an increase in p62 inclusion in HT22 cell line upon Nup50 knock-down (Two-tailed Nested t test: t = 9 846, df = 17,****p < 0.0001). g, h Dot-plots showing a significant increase in neuronal death (g) in HT22 cell lines (Two-tailed Nested t test: t = 3721, df = 24, **p = 0.0011) and in mouse primary neurons (h) (Two-tailed Nested t test: t = 3,18, df = 34, **p = 0.0031) For all panels, data are presented as mean values ± SEM. n = 3 independent experiments performed at least in duplicate. Each dot in the scatter plot indicates the mean of an individual experiment. All experiments were performed 24 h after transfection. |
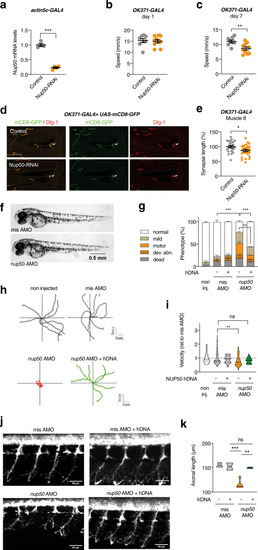
knockdown of Nup50 leads to motor defects in Drosophila and Zebrafish.
a Drosophila Nup50 mRNA expression level (% driver-only control) in third instar larvae ubiquitously (actin5C-GAL4) expressing Nup50-RNAi. n = 4 per genotype; ***p < 0.0001 by two tailed unpaired t test. Data are presented as mean values ± SEM b, c Climbing speed in automated negative geotaxis assay of 1- (b) or 7-day-old (c) male flies expressing Nup50-RNAi in motor neurons (OK371-GAL4). Independent groups of 10 flies: n = 8 (control); n = 10 (OK371-GAL4) **p = 0.0061 by unpaired two tailed t test. Data are presented as mean values ± SEM d Representative images of the NMJ on muscle 8 (white arrow) visualized by membrane GFP (UAS-mCD8-GFP) in motor neurons (OK371-GAL4) labeling axons and presynaptic compartment of NMJs (green), and dlg1 (postsynaptic compartment of NMJs, red) in third instar larvae expressing Nup50-RNAi in motor neurons (OK371-GAL4) compared to driver-only control. Scale bar: 100 μm. e Synapse length on distal muscle 8 of third instar larvae expressing Nup50-RNAi selectively in motor neurons (OK371-GAL4). n = 23–28 per genotype; *p < 0.05 by unpaired two-tailed t test. Data are presented as mean values ± SEM. f Representative images of 48 hpf zebrafish embryos showing no difference on global morphology. g Distribution of motor phenotypes of 48 hpf zebrafish embryos among the different conditions. Data are presented as mean +sem; **p < 0,01 and ****p < 0,0001 by Tukey’s multiple comparison test following 2way ANOVA. Number of independent embryos per condition: n = 82 non-injected, n = 56 misAMO, n = 53 misAMO+hDNA, n = 87 nup50 AMO, n = 54 nup50 AMO + hDNA in two different crossings. h, i Representative swimming trajectories of 48 hpf zebrafish embryos upon TEER test (h) and quantification (i). Each dot represents one embryo. Data normalized to mis AMO control are presented as violin plot. Solid line: median; dashed lines: quartiles. **p < 0,01 and non-significant (ns) by One-way ANOVA followed by Tukey’s multiple comparison test. n = 92 non injected, n = 83 misAMO, n = 24 misAMO+hDNA, n = 111 nup50 AMO, n = 19 nup50 AMO + hDNA. j, k: Representative images of spinal motor neurons of 48 hpf zebrafish embryos (j) and corresponding quantification. Data are presented as violin plot. Solid line: median; dashed lines: quartiles. **p < 0,01, ***p < 0.001 and non-significant (ns) by Tukey’s multiple comparison test following 1way ANOVA. n = 4 misAMO, n = 2 misAMO+hDNA, n = 4 nup50 AMO, n = 3 nup50 AMO + hDNA. |
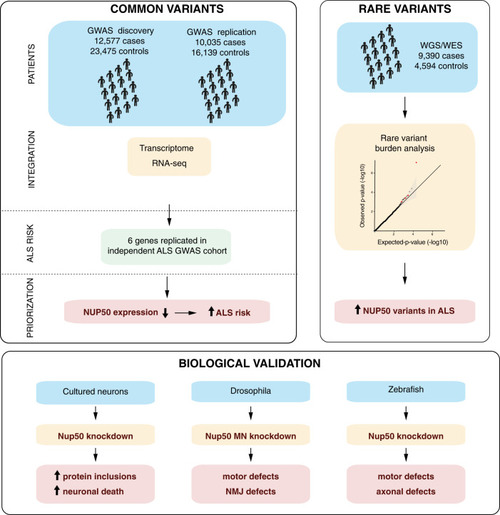
summary of the major results of the study.
The three major results of our study are graphically summarized. See discussion for details. |