
Fig. 1
- ID
- ZDB-FIG-230124-52
- Publication
- Megat et al., 2023 - Integrative genetic analysis illuminates ALS heritability and identifies risk genes
- Other Figures
- All Figure Page
- Back to All Figure Page
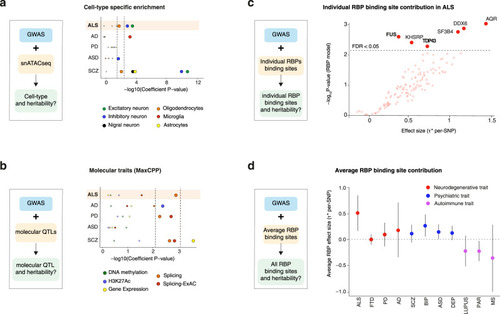
Cell type specific and molecular trait heritability of ALS.
a Strategy to characterize cell-type specific heritability through integration of GWAS with single nuclei ATACseq (snATACseq) data (left) and p-values for enrichment in cell-type specific heritability in considered diseases (right). Dots indicate two-sided −log10 (P-values) of enrichment obtained by linear regression model in LDSC analysis. Top dashed line indicates statistically significant enrichments after correction for multiple testing over all diseases (n = 5), cell types (n = 6) with Bonferroni correction p < 0.05. Bottom dashed lines indicated statistically significant enrichments after Benjamini–Hochberg multiple correction FDR < 0.05. Results indicate enrichment for inhibitory and excitatory neurons in ALS, but not in other neurodegenerative diseases. b Strategy to characterize molecular QTL-related heritability through integration of GWAS with QTLs data (left) and P-values for enrichment in heritability for 5 molecular traits in considered diseases (right). Dots indicate indicates two-sided −log10 (P-values) of enrichment obtained by linear regression model in LDSC analysis. Top dashed line indicates statistically significant enrichments after correction for multiple testing over all diseases (n = 5), molecular QTLs (n = 5) with Bonferroni correction p < 0.05. Bottom dashed lines indicated statistically significant enrichments after Benjamini–Hochberg multiple correction FDR < 0.05. Results indicate a global enrichment in sQTLs in ALS, PD and SCZ. Higher dashed lines indicate Bonferroni corrected p-values < 0.05 while lower dashed lines indicates FDR < 0.05. c Strategy to characterize individual RBP binding site heritability through integration of GWAS with RBP binding site data The per-SNP heritability effect sizes (τ*) for each RBP target site dysregulation is plotted for ALS GWAS. The dashed line indicates RBP models FDR < 0.05 threshold after multiple hypothesis correction (block jackknife-based one-sided p-values; Benjamini–Hochberg correction). d The per-SNP heritability effect sizes (τ*) for RBPs after conditioning on a collection of molecular QTL annotations (i.e. independent RBP effects from molecular QTLs and baseline annotations). Circle dots represent the mean of RBP effect size for each disease and error bars are 95% CI. ALS amyotrophic lateral sclerosis, FTD fronto-temporal dementia, PD Parkinson’s disease, AD Alzheimer’s disease, SCZ Schizophrenia, DEP depression, BIP bipolar disorder, ASD autism spectrum disorder, PAR rheumatoid arthritis, MS multiple sclerosis. |