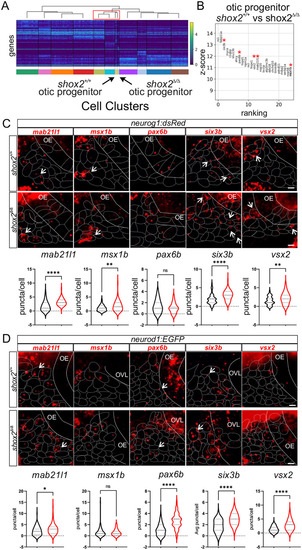
Determining differential gene expression between shox2+/+ and shox2Δ/Δ otic progenitors and developing neurons. (A) Heat map displaying transcript levels of the fifty variable genes for individual cells from each cluster identified in the progenitor population. Cells from each cluster is marked by a different color rectangle at the bottom of the heatmap. Arrows point to otic progenitor populations from shox2+/+ and shox2Δ/Δ embryos. Dendrogram displays the similarity and relationship between cell populations. (B) Differential expression analysis of genes from shox2+/+ otic progenitors with shox2Δ/Δ mutant otic progenitor. The z-score associated with each gene represents the number of standard deviation away from the mean gene transcript levels between shox2+/+ and shox2Δ/Δ cells. The ranking of significantly altered genes is based on the z-score. Red asterisks denote transcripts that are subjected to smFISH. smFISH using mab21l1, msx1b, pax6b, six3b and vsx2 probes was performed on 24 hpf shox2+/+ and shox2Δ/Δ embryos in (C) TgBAC(neurog1:dsRed) or (D) TgBAC(neurod1:EGFP) larvae. For TgBAC(neurog1:dsRed) lines, the following number of embryos were used for each smFISH probe: mab21l1 (shox2+/+, n=15; shox2Δ/Δ, n=12), msx1b, (shox2+/+, n=15; shox2Δ/Δ, n=13), pax6b (shox2+/+, n=15; shox2Δ/Δ, n=13), six3b (shox2+/+, n=14; shox2Δ/Δ, n=13) and vsx2 (shox2+/+, n=15; shox2Δ/Δ, n=12). For TgBAC(neurod1:EGFP) lines, the following number of embryos were used for each smFISH probe: mab21l1 (shox2+/+, n=13; shox2Δ/Δ, n=12), msx1b, (shox2+/+, n=15; shox2Δ/Δ, n=12), pax6b (shox2+/+, n=15; shox2Δ/Δ, n=13), six3b (shox2+/+, n=15; shox2Δ/Δ, n=13) and vsx2 (shox2+/+, n=15; shox2Δ/Δ, n=12). Quantification of puncta per cell from whole-mount zebrafish at 24 hpf in dsRed or EGFP marked cells displayed as violin plots from shox2+/+ (black) and shox2Δ/Δ (red) embryos. Solid lines mark the otic epithelium (OE) and otic vesicle lumen (OVL) in the images, while dashed lines outline cells expressing the fluorescent transgenes. Values reported (mean±s.e.m.). Statistical tests were performed on the number or larvae from each sample using Welch's t-test. n.s. (not significant), *P≤0.05, **P≤0.01, ****P≤ 0.0001. Scale bars: 10 µm.
|
