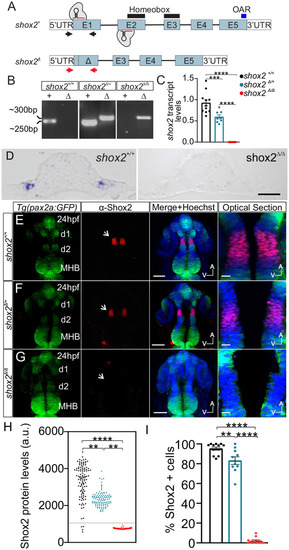
Generating shox2 mutant zebrafish. (A) Genomic representation of wild-type shox2 (shox2+) gene containing five exons (E1-5), 5′ and 3′ untranslated regions (UTRs). Black lines above exons 2 and 3 demarcate the coding region for the homeobox domain. The blue line above exon 5 marks the otp, aristaless, and rax (OAR) domain. Black arrows represent the approximate primer binding sites utilized for PCR genotyping of shox2+. The shox2 null allele was generated using two CRISPR/Cas9 sgRNAs complexes that bind and cleave in exons 1 and 2. Repair and joining of the two cut sites deleted genomic DNA containing parts of exon1 and 2 to create the shox2 null allele (shox2Δ). Red arrows denote the approximate binding site of primer pairs for PCR genotyping of shox2Δ. (B) shox2Δ (Δ) and shox2+ (+) PCR products using DNA obtained from shox2+/+,shox2Δ/+, and shox2Δ/Δ embryos. (C) Quantification of shox2 transcript levels by RT-qPCR. shox2+/+ (1.00±.08; n=11), shox2Δ/+ (0.59±0.05; n=8) and shox2Δ/Δ (0.0003±0.0001; n=11) embryos. Each dot represents data from an individual embryo at 24 hpf. (D) Section of the otic placode in 18 somite stage embryos after in situ hybridization with shox2 probe in shox2+/+ and shox2Δ/Δ embryos. Whole-mount immunofluorescence labeling of Shox2 on 24 hpf embryos from (E) shox2+/+, (F) shox2Δ/+ and (G) shox2Δ/Δ larva in the Tg(pax2a: GFP) reporter background. Fluorescent images from Tg (pax2a: GFP) (green) reporter, Shox2 (red) immunostaining, merged image with Hoechst (blue). Magnified images show optical sections of merged images. Arrows point to the diencephalic region with Shox2 expression. Optical sections of the region flanked by d1 and d2 containing nuclear Shox2 labeling were used for fluorescence quantification. (H) Shox2 immunofluorescence signal from individual cells taken from shox2+/+ (3544±44.8 a.u., n=965 cells, 12 embryos), shox2Δ/a (2279±32.1 a.u., n= 687 cells, ten embryos) and shox2Δ/Δ (744.9±4.9 a.u., n=885 cells, 11 embryos). A threshold of two standard deviation above average background signal (1053 a.u.) was set (dotted line). Cells above the threshold were considered Shox2 positive and used for comparison. (I) Percent of Shox2 expressing cells in cohort in shox2+/+ (95.3±1.6%), shox2Δ/a (83.2±3.9%) and shox2Δ/Δ (1.95±1.0%) larvae. Cell and embryo numbers as listed above. One-way ANOVA and Sidak multiple comparisons tests were used for statistical analysis. Values reported as mean±s.e.m. **P≤0.01, ***P≤ 0.001; ****P≤ 0.0001. d1-d2; diencephalic domain 1 and 2; MBH, mid hindbrain boundary; a.u., arbitrary units, s.e.m. standard error of the mean. Scale bars: 10 µm.
|
