
Fig. 3
- ID
- ZDB-FIG-221220-55
- Publication
- Samper-Martín et al., 2021 - Polyphosphate degradation by Nudt3-Zn2+ mediates oxidative stress response
- Other Figures
- All Figure Page
- Back to All Figure Page
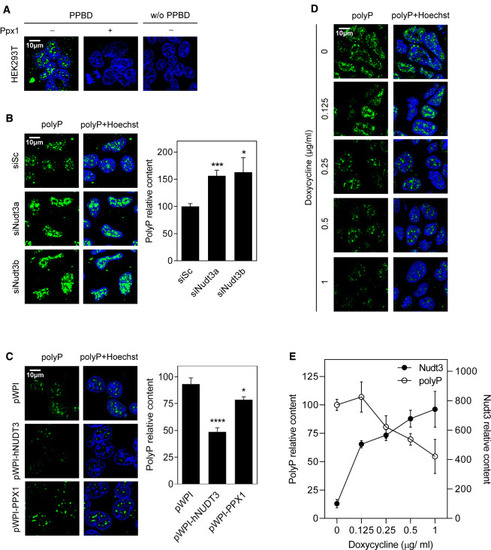
Figure 3. Nudt3 is a polyPase in vivo (A) Validation of polyP signal detection. Immunofluorescence images of HEK293T human cells where polyP was detected using Xpress-PPBD (Xpress-tagged version of E. coli polyP binding domain protein), coupled with anti-Xpress antibody and anti-goat Alexa488 conjugated secondary antibody. Cells were treated (or not) with 1 μg of yeast exo-polyPase to deplete polyP and show specificity for polyP signal. Nuclei were stained using Hoechst. Negative control was without Xpress-PPBD. (B) Nudt3 silencing increases nuclear polyP content. HEK293T cells were transfected with scrambled (Sc) RNA (10 nM) or with two different Nudt3-targeting siRNA (siNudt3a and siNudt3b) at 10 nM. After 48 h, polyP was detected as in (A). Representative images are in the left panel. The graph is for quantification (see STAR Methods) representing the mean ± SEM of at least eight different pictures from four independent experiments. A minimum of 500 cells per condition were analyzed. (C) Constitutive overexpression of human Nudt3 decreases nuclear polyP content. HEK293T human cells were transfected with empty pWPI, pWPI-hNUDT3, or pWPI-scPPX1 (S. cerevisiae exo-polyPase). Polyphosphate was detected as in (A). Representative images are in the left panel. Quantification of 20 pictures from three independent experiments with a minimum of 1,300 cells per condition is in the right panel. Mean ± SEM is presented. (D and E) Nudt3 depletes nuclear polyP in a dose-dependent manner. HEK293T human cells were transfected with empty pAdvanced and pRetroX or pAdvanced and pRetroX-hNudt3 permitting the expression of the human Nudt3 gene by adding different amounts of doxycycline. 48 h after transfection, the indicated amount of doxycycline was added, and after 72 h polyP was detected as in (A). (D) Representative images. (E) Quantification of at least five pictures of three independent experiments. A minimum of 200 cells per condition were analyzed. Mean ± SEM is provided. The scale bars represent 10 μm. See also Figure S2. ∗∗∗p < 0.001; ∗∗p < 0.01; ∗p < 0.05. |