
- Title
-
Polyphosphate degradation by Nudt3-Zn2+ mediates oxidative stress response
- Authors
- Samper-Martín, B., Sarrias, A., Lázaro, B., Pérez-Montero, M., Rodríguez-Rodríguez, R., Ribeiro, M.P.C., Bañón, A., Wolfgeher, D., Jessen, H.J., Alsina, B., Clotet, J., Kron, S.J., Saiardi, A., Jiménez, J., Bru, S.
- Source
- Full text @ Cell Rep.
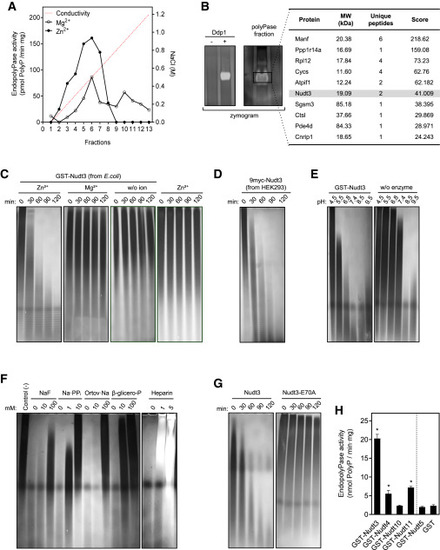
Figure 1. Nudt3 is a Zn2+-dependent endo-polyPase (A) Heparin affinity fractionation step. After tissue homogenization, cell lysis, and centrifugation, the supernatant was loaded into a heparin-based affinity chromatography column. Proteins were eluted by applying a NaCl-based ionic strength gradient (dashed line). Endo-polyPase activity was assayed using the indicated divalent cations (see STAR Methods section). (B) PolyP-zymogram and mass spectrometry identification. The left panel shows a proof of concept for the polyP-zymogram: recombinant yeast Ddp1 was separated in a non-denaturing acrylamide gel containing polyP. polyPase activity was permitted by incubating the gel in the appropriate conditions. The gel was stained with DAPI. In the right panel, containing activity aliquot from the size exclusion column was analyzed in the polyP-zymogram as above. The area where the polyPase activity appeared was excised, and proteins were identified by tandem mass spectrometry analysis. A list of the proteins showing the higher score is provided. (C and D) Human Nudt3 obtained from E. coli (C) and the HEK293T cell line (D) have Zn2+-dependent endo-polyPase activity. Nudt3 was incubated with 5 μg of polyP100 for the indicated times in the presence of 5 mM of the noted cations, electrophoretically separated in PAGE-urea gels, and polyP was visualized using DAPI staining. (E) Nudt3 is active at physiological pH. Nudt3 was incubated at different pH values with 5 μg of polyP100; polyP was separated in PAGE-urea gels and stained with DAPI. (F) Nudt3 endo-polyPase activity is inhibited by phosphatase inhibitors. As in (C), using 5 mM Zn2+ as a cation and the concentration of the noted inhibitors. incubation time was 1 h. (G) Nudt3E70A does not present endo-polyPase activity. As in (C) using 5 mM Zn2+. (H) Endo-polyPase activity quantification of the different members of the human DIPP family purified from E. coli. As in (C) using 5 mM Zn2+. Incubation time was 1 h. Mean ± SEM of three independent experiments. ∗∗∗p < 0.001; ∗∗p < 0.01; ∗p < 0.05. See also Figures S1 and S2. |
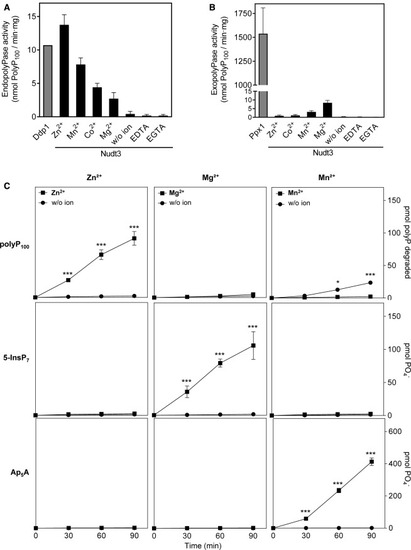
Figure 2. Nudt3 substrate specificity is ion dependent (A) Divalent ion dependence of Nudt3 endo-polyPase activity. Quantification of DAPI-stained PAGE-urea gels as in Figure 1. Nudt3 (100 ng) and polyP100 were incubated for 1 h in the presence of the mentioned ions (5 mM each), EDTA, or EGTA (10 mM). 100 ng of yeast recombinant endo-polyPase Ddp1 (Nudt3 homolog) is used as control. Mean ± SEM of three independent experiments. (B) Exo-polyPase activity of Nudt3. The enzymatic reaction was as in (A). The activity was measured as free phosphate production using the malachite green method. Yeast recombinant exo-polyPase Ppx1 (1 ng) is used as a control. Mean ± SEM of three independent experiments. (C) Enzymatic activity quantification of Nudt3 on the noted substrates (up to down: polyP100, 5-InsP7, and Ap5A) in the presence of the indicated cations (5 mM). Mean ± SEM of three independent experiments. ∗∗∗p < 0.001; ∗∗p < 0.01; ∗p < 0.05. |
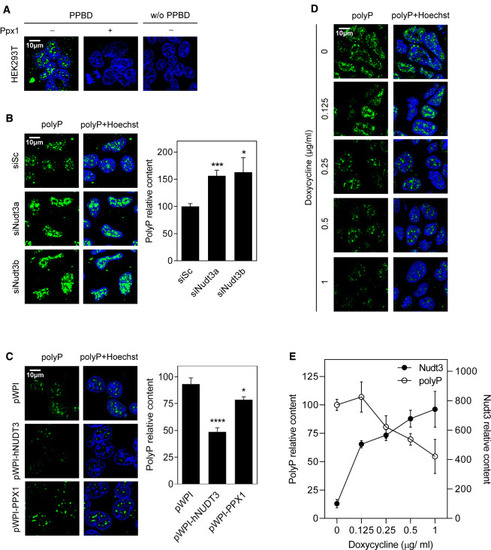
Figure 3. Nudt3 is a polyPase in vivo (A) Validation of polyP signal detection. Immunofluorescence images of HEK293T human cells where polyP was detected using Xpress-PPBD (Xpress-tagged version of E. coli polyP binding domain protein), coupled with anti-Xpress antibody and anti-goat Alexa488 conjugated secondary antibody. Cells were treated (or not) with 1 μg of yeast exo-polyPase to deplete polyP and show specificity for polyP signal. Nuclei were stained using Hoechst. Negative control was without Xpress-PPBD. (B) Nudt3 silencing increases nuclear polyP content. HEK293T cells were transfected with scrambled (Sc) RNA (10 nM) or with two different Nudt3-targeting siRNA (siNudt3a and siNudt3b) at 10 nM. After 48 h, polyP was detected as in (A). Representative images are in the left panel. The graph is for quantification (see STAR Methods) representing the mean ± SEM of at least eight different pictures from four independent experiments. A minimum of 500 cells per condition were analyzed. (C) Constitutive overexpression of human Nudt3 decreases nuclear polyP content. HEK293T human cells were transfected with empty pWPI, pWPI-hNUDT3, or pWPI-scPPX1 (S. cerevisiae exo-polyPase). Polyphosphate was detected as in (A). Representative images are in the left panel. Quantification of 20 pictures from three independent experiments with a minimum of 1,300 cells per condition is in the right panel. Mean ± SEM is presented. (D and E) Nudt3 depletes nuclear polyP in a dose-dependent manner. HEK293T human cells were transfected with empty pAdvanced and pRetroX or pAdvanced and pRetroX-hNudt3 permitting the expression of the human Nudt3 gene by adding different amounts of doxycycline. 48 h after transfection, the indicated amount of doxycycline was added, and after 72 h polyP was detected as in (A). (D) Representative images. (E) Quantification of at least five pictures of three independent experiments. A minimum of 200 cells per condition were analyzed. Mean ± SEM is provided. The scale bars represent 10 μm. See also Figure S2. ∗∗∗p < 0.001; ∗∗p < 0.01; ∗p < 0.05. |
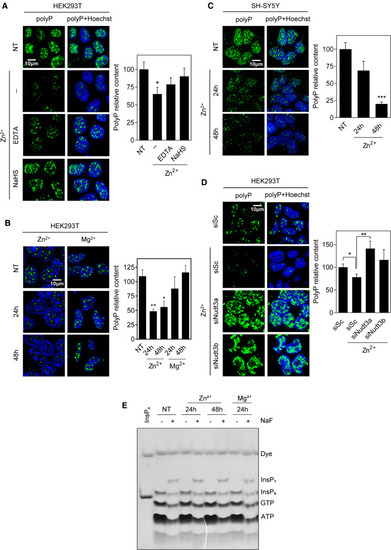
Figure 4. Nudt3 is a Zn2+-dependent polyPase in vivo (A) Zn2+ decreases nuclear polyP content. HEK293T cells were grown with 100 μM Zn2+ in the medium and with the chelators EDTA or NaHS (200 μM) for 48 h. Polyphosphate was detected as in Figure 3A. Representative pictures are in the left panel. Quantification of at least 10 pictures from three independent experiments is in the right panel. A minimum of 500 cells per condition were analyzed. Mean ± SEM is provided. (B) Mg2+ does not affect nuclear polyP content. HEK293T cells were grown in the presence of Zn2+ or Mg2+ (100 μM) for 24 and 48 h. Polyphosphate was detected, and representative pictures are in the left panel. Quantification of five pictures containing more than 200 cells per condition from one experiment is presented. (C) Zn2+ controls polyP content in the brain cell line SH-SY5Y. Cells were grown in the presence of 100 μM Zn2+ for 24 and 48 h. Polyphosphate was detected, and representative pictures are in the left panel. Quantification of three pictures containing a minimum of 100 cells from one experiment. (D) Zn2+ effect on polyP is dependent on Nudt3. Nudt3 was silenced in HEK293T cells and after 24 h, 100 μM Zn2+ was added. Polyphosphate was detected after 24 h. Representative pictures are in the left panel. Quantification of 15 pictures from three independent experiments is in the right panel. A minimum of 300 cells per condition were analyzed. Mean ± SEM is provided. (E) Inositol pyrophosphate (InsP7) is not affected by Zn2+. HEK293T cells were grown in the presence of 100 μM Zn2+ or Mg2+ for 24 and 48 h. Cells were treated with 10 mM NaF for 1 h to raise the InsP7 intracellular levels and ensure its visualization in a 35% PAGE gel. InsP6 was included as a size marker at the left line. The scale bars represent 10 μm. NT, not treated. See also Figure S2. ∗∗∗p < 0.001; ∗∗p < 0.01; ∗p < 0.05. |
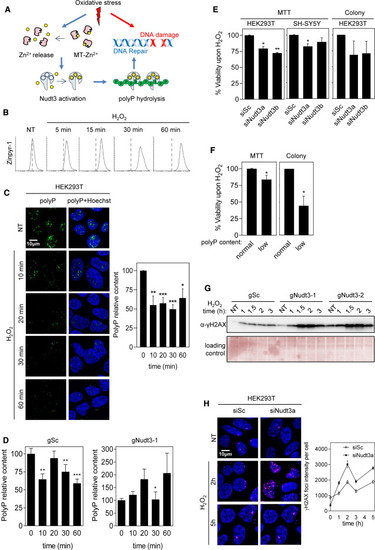
Figure 5. Nudt3 Zn2+-dependent polyP degradation is needed for cell viability upon oxidative stress (A) Working model. Oxidative stress leads to DNA damage and acts on the redox-sensitive metallothioneins (MTs) determining the release of intracellular Zn2+, which, in turn, activates the polyPase activity of Nudt3 and the depletion of polyP. The degradation of polyP protects DNA from oxidative damage and, as a result, cell viability is increased. (B) Oxidative stress increases intracellular free Zn2+ in HEK293T. Cells were exposed to 50 μM H2O2 at the indicated times, treated with Zinpyr for 1 h, and the green fluorescence intensity was measured by FACS analysis. 10,000 events were recorded. (C) Oxidative stress reduces polyP content. HEK293T cells were treated with 30 μM H2O2 for the noted time and immediately fixed. Polyphosphate content was detected, and representative pictures are in the left panel. The quantification of three independent experiments is in the right panel. The mean ± SEM is provided. A minimum of 400 cells per condition were analyzed. (D) PolyP reduction upon oxidative stress is Nudt3 dependent. HEK293T cells, in which Nudt3 has been depleted by CRISPR-Cas, were treated with 30 μM H2O2 for the noted times and immediately fixed. Scrambled guide (gSc) is used as control and gNudt3-1 is the specific guide for targeting Nudt3 gen. Polyphosphate content was detected by immunofluorescence as in Figure 3A. The graph represents the quantification of three independent experiments. The mean ± SEM is provided. A minimum of 400 cells per condition were analyzed. (E and F) Cell viability upon oxidative stress is dependent on Nudt3 polyPase activity. (E) Nudt3 was silenced in HEK293T and SH-SY5Y. After 48 h, 30 μM H2O2 was added, and 24 h later, MTT was performed. In the case of colony formation assays, cells were treated with 100 μM H2O2 for 1 h. Mean ± SEM from three independent experiments is shown. (F) Nudt3 was overexpressed as in Figure 3C (note that overproduction of Nudt3 leads to polyP depletion, noted as low polyP content. This effect is similar to being unable to use polyP as a result of Nudt3 silencing). Viability was measured as MTT and colony-forming in HEK293T cells were grown in the absence or presence of 30 μM H2O2 for 24 h (for the MTT experiments) and 100 μM for 1 h for the colony-forming assays. Mean ± SEM from three independent experiments is represented. (G and H) DNA damage upon oxidative stress is Nudt3 dependent. (G) Nudt3 was knocked down in HEK293T cells by using two different CRISPR-Cas9 guides. After 72 h, cells were treated with 100 μM H2O2 for 1 h and washed with fresh medium. Histone H2AX phosphorylation was detected by western blot with specific antibodies. Time is from the moment in which H2O2 was added. (H) Nudt3 was silenced in HEK293T cells. After 48 h cells were treated with 100 μM H2O2 for 1 h and washed with fresh medium. Histone phosphorylated foci were detected by immunofluorescence (using specific antibodies as in G). Representative images and fluorescence intensity (mean ± SEM) quantification from one experiment where a minimum of 250 cells were analyzed. The scale bars represent 10 μm. See also Figures S3 and S4. ∗∗∗p < 0.001; ∗∗p < 0.01; ∗p < 0.05. |