FIGURE

Figure 5.

ID
ZDB-FIG-221211-302
Publication
Nie et al., 2022 - Single-cell transcriptomes and runx2b-/- mutants reveal the genetic signatures of intermuscular bone formation in zebrafish
Other Figures
All Figure Page
Back to All Figure Page
Figure 5.

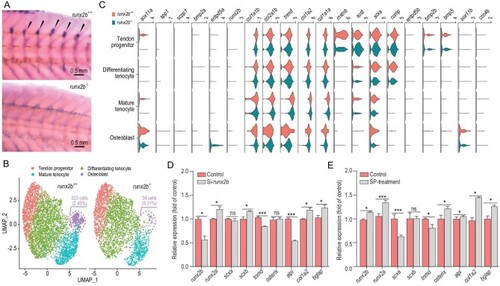
Comparative transcriptome analysis of runx2b+/+ and runx2b−/− zebrafish, and overexpression and knockdown analysis of runx2b. (A) In situ hybridization of runx2b in the tissue of origin of IBs (IBs, shown with arrowheads). The expression of runx2b was significantly reduced in runx2b−/− zebrafish. (B) UMAP visualization of tendon progenitors, mature tenocytes, differentiating tenocytes and osteoblasts in runx2b+/+ and runx2b−/−zebrafish. The ratios of osteoblasts to the total number of cells in runx2b+/+ and runx2b−/− zebrafish were 2.44% (340 cells) and 0.31% (34 cells), respectively. (C) Violin plots showing expression of differentially expressed genes in each cluster related to IB formation between runx2b+/+ and runx2b−/−zebrafish. (D, E) Overexpression and knockdown analysis of runx2b in IB cells of M. amblycephala. The expression levels of genes related to osteoblasts were detected by qRT-PCR. ANOVA (analysis of variance) was used to test the differences in expression. ns, P > 0.05; *, P < 0.05; **, P < 0.01; ***, P < 0.001.

Expression Data

Expression Detail
Antibody Labeling
Phenotype Data

Phenotype Detail
Acknowledgments
This image is the copyrighted work of the attributed author or publisher, and ZFIN has permission only to display this image to its users. Additional permissions should be obtained from the applicable author or publisher of the image. Full text @ Natl Sci Rev