
FIGURE
Figure 4.
- ID
- ZDB-FIG-221211-296
- Publication
- Nie et al., 2022 - Single-cell transcriptomes and runx2b-/- mutants reveal the genetic signatures of intermuscular bone formation in zebrafish
- Other Figures
- All Figure Page
- Back to All Figure Page
Figure 4.
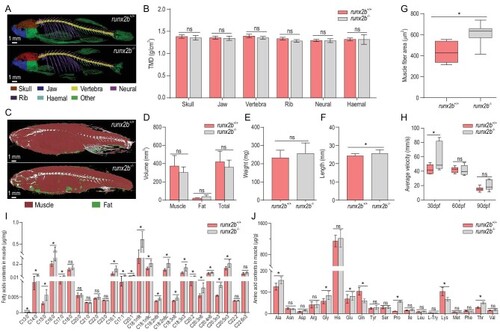
Comparison of characteristics of other bones, swimming performance and muscle nutrient content between |
Expression Data
Expression Detail
Antibody Labeling
Phenotype Data
Phenotype Detail
Acknowledgments
This image is the copyrighted work of the attributed author or publisher, and
ZFIN has permission only to display this image to its users.
Additional permissions should be obtained from the applicable author or publisher of the image.
Full text @ Natl Sci Rev