
Fig. 5
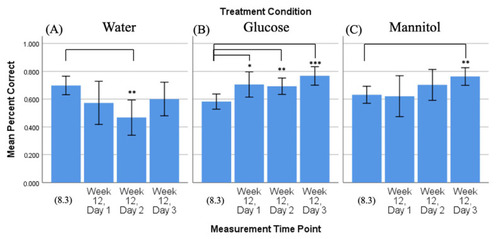
Comparison of 8-week vs. 12-week reversal. Mean percent correct scores (+/−95% CI) calculated on 8-week reversal day 3 (8.3) were compared to scores calculated on all three 12-week reversal days for (A) water-treated, (B) glucose-treated, and (C) mannitol-treated fish using individual t-tests. Water-treated fish showed a reduction in correct scores on day 2 (panel (A), **). Glucose-treated fish showed significantly more correct scores on all three 12-week reversal days (day 1 p = 0.02; day 2 p = 0.006; day 3 p < 0.001), indicating that these fish were able to find the location of the shoal reward. *,**,*** Asterisks in (B) denote significant differences, where the number of asterisks denotes level of significance. Mannitol-treated fish showed significantly increased scores by day 3 (p = 0.003, (panel (C), **)). |