
FIGURE
Fig. 3
- ID
- ZDB-FIG-220822-75
- Publication
- Haigis et al., 2022 - Getting more out of the zebrafish light dark transition test
- Other Figures
- All Figure Page
- Back to All Figure Page
Fig. 3
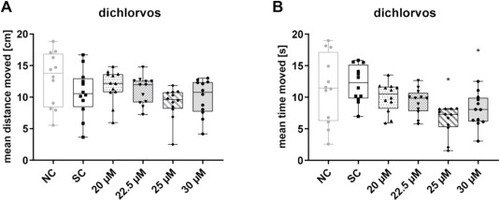
Fig. 3. Results representing the transition from light to darkness. The differences due to the transition are expressed as mean distance moved [cm] (A) or mean time moved [s] (B) calculated from the last minute during light and the first minute of the dark period. Error bars indicate the standard deviation. Data were derived from three replicates with 12 organisms each. * = p < 0.05. |
Expression Data
Expression Detail
Antibody Labeling
Phenotype Data
Phenotype Detail
Acknowledgments
This image is the copyrighted work of the attributed author or publisher, and
ZFIN has permission only to display this image to its users.
Additional permissions should be obtained from the applicable author or publisher of the image.
Full text @ Chemosphere