
FIGURE
Fig. 2
- ID
- ZDB-FIG-220822-74
- Publication
- Haigis et al., 2022 - Getting more out of the zebrafish light dark transition test
- Other Figures
- All Figure Page
- Back to All Figure Page
Fig. 2
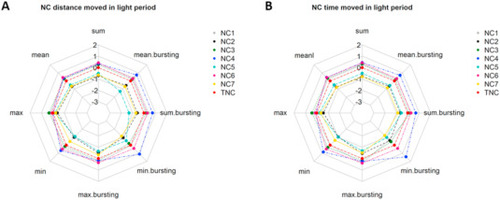
Fig. 2. Behavioural response of 5 dpf embryos during the light period. Plotted data depict respective controls normalized to the mean of all controls (NTC/STC) from the same condition (distance/duration) and log2 transformed. A) shows the distance moved by NCs and B) the time moved during the light period. NC = negative control (zfet), TSC = total NC. |
Expression Data
Expression Detail
Antibody Labeling
Phenotype Data
Phenotype Detail
Acknowledgments
This image is the copyrighted work of the attributed author or publisher, and
ZFIN has permission only to display this image to its users.
Additional permissions should be obtained from the applicable author or publisher of the image.
Full text @ Chemosphere