
- Title
-
Getting more out of the zebrafish light dark transition test
- Authors
- Haigis, A.C., Ottermanns, R., Schiwy, A., Hollert, H., Legradi, J.
- Source
- Full text @ Chemosphere
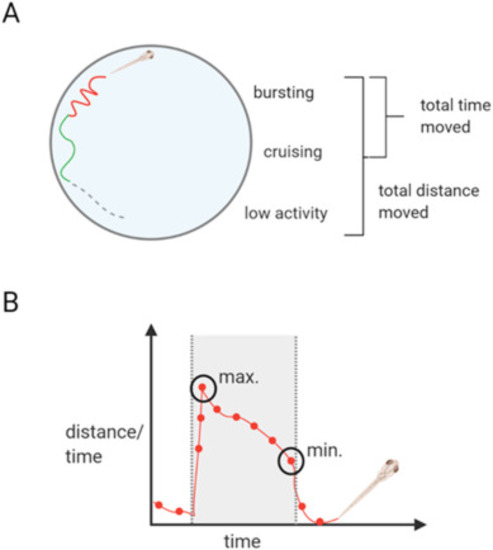
Fig. 1. LDT experiment parameter introduction The figure displays how data were retrieved from one exemplary embryo. A) Total distance was calculated based on zebrafish embryo low activity (grey dashed line, <0.3 cm/s), cruising (green line, 0.3–1 cm/s) and bursting (red line, > 1 cm/s). Total time moved was calculated based on cruising and bursting only as including low activity would add up to the whole minute of tracking. Bursting (red line) was used as an additional parameter for which sum and mean were calculated. B) depicts an exemplary behaviour course of an embryo in darkness (grey background) and the timely occurrence of min. and max.. Dots represent exemplary 1-min time bins, which were extracted for min and max analyses. Created with BioRender.com. (For interpretation of the references to colour in this figure legend, the reader is referred to the Web version of this article.) |
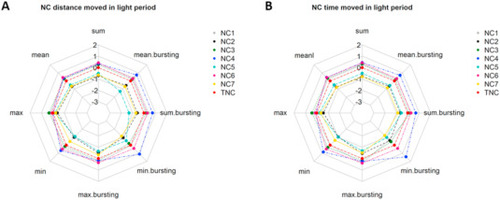
Fig. 2. Behavioural response of 5 dpf embryos during the light period. Plotted data depict respective controls normalized to the mean of all controls (NTC/STC) from the same condition (distance/duration) and log2 transformed. A) shows the distance moved by NCs and B) the time moved during the light period. NC = negative control (zfet), TSC = total NC. |
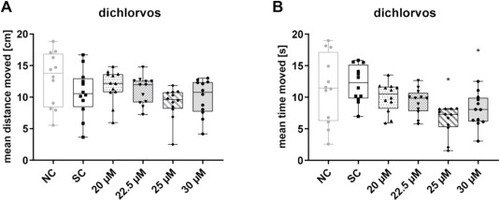
Fig. 3. Results representing the transition from light to darkness. The differences due to the transition are expressed as mean distance moved [cm] (A) or mean time moved [s] (B) calculated from the last minute during light and the first minute of the dark period. Error bars indicate the standard deviation. Data were derived from three replicates with 12 organisms each. * = p < 0.05. |

Fig. 4. Bar graphs from the LDT test using 5 dpf embryos and exposed for five days to dichlorvos. Data are displayed as mean of the total distance moved/10 min time interval. Error bars indicate the standard deviation. Data were derived from three replicates with 12 organisms each. SC = 0.01% DMSO, n = 3, * = p < 0.05. |
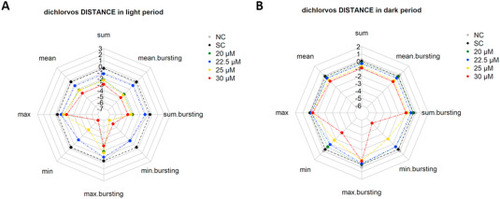
Fig. 5. Results from the LDT test using 5 dpf embryos exposed for five days to dichlorvos. Radar charts depict behavioural parameters regarding the distance moved by embryos in light (A) and darkness (B). Sum/mean total = sum/mean total distance moved by embryos, max./min. total = mean of maximum/minimum total distance moved by embryos, max./min. bursting = mean of maximal/minimal distance moved by embryos during burst, sum/mean bursting = sum/mean total distance moved by embryos during burst. Maximum/minimum refers to the farthest/shortest distance measured for embryonic movement. SC = 0.01% DMSO, n = 3. |