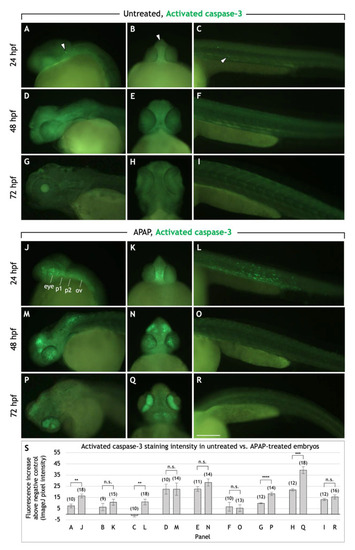
APAP treatment increases apoptosis in the head and pharyngeal arches before and during cartilage differentiation. Lateral and rostroventral views of the head and trunk regions in 24, 48, and 72 hpf embryos processed for anti-activated caspase-3 immunohistochemistry to detect apoptotic cells. In untreated embryos, apoptotic cells are sparsely distributed in the head and trunk (white arrowheads in (A–C) as examples). In APAP-treated embryos at 24 hpf (J–L), apoptosis is substantially increased between the eyes (K) and along the length of the head (J), in the regions where the mandibular and hyoid arches (1st and 2nd pharyngeal arches) are forming. Apoptotic cells are also increased throughout the trunk (L), but by 48 and 72 hpf, are similar to control levels (O,R). At 48 hpf, large clusters of apoptotic cells are located in the dorsal head region and throughout the eye (M,N). At 72 hpf, apoptotic cells are concentrated in the iris, with significant numbers also between the eyes and at the base of the head. Abbreviations: First pharyngeal arch, b1; second pharyngeal arch, b2; otic vesicle, ov. Scale bar (in (R)) for (A–R), 200 µm. (S): Quantification of staining intensity across samples represented in panels A-R. Lateral views of the head (A,D,G,J,M,P) were analyzed by measuring pixel intensity within the head region from the rostral-most portion through the otic vesicle. For ventral views of the head (B,E,H,K,N,Q), pixel intensity was measured within the entire head anterior to the yolk. For lateral views of the trunk (C,F,I,L,O,R), pixel intensity was measured within the trunk region dorsal to the yolk extension. For all images, negative control values were subtracted from actual values in order to report the overall fluorescence increase. The total number of embryos tested are in parentheses. ** = t-test at p < 0.01. *** = t-test at p < 0.001. **** = t-test at p < 0.0001. n.s. = not significant (p > 0.05). Error bars indicate the standard error of the mean.
|
