
Fig. 4
- ID
- ZDB-FIG-220701-28
- Publication
- Kenny et al., 2022 - TFAP2 paralogs facilitate chromatin access for MITF at pigmentation and cell proliferation genes
- Other Figures
- All Figure Page
- Back to All Figure Page
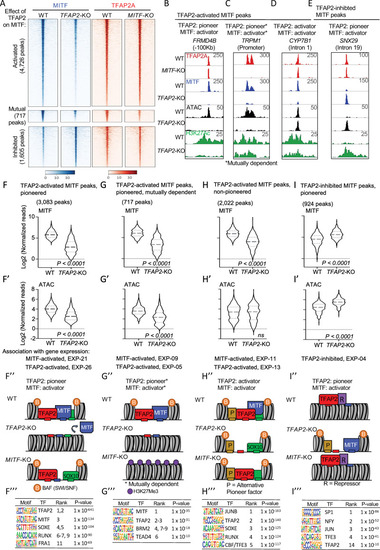
TFAP2 paralogs facilitate chromatin access by MITF.
(A) Density heatmaps of anti-MITF CUT&RUN-seq in WT and TFAP2-KO SK-MEL-28 cells, and anti-TFAP2 CUT&RUN-seq in WT and MITF-KO SK-MEL-28 cells at TFAP2-dependent MITF peaks (first cluster), mutually dependent peaks (second cluster) and TFAP2-inhibited MITF peaks (third cluster). Number of peaks in each group as labelled. Regions shown are +/- 3 kb from peak center, normalized reads (RPKM). (B-E) Screenshot of IGV genome browser (GRCH37/hg19), showing anti-TFAP2A (red) CUT&RUN-seq in WT and MITF-KO cells, and anti-MITF (blue) CUT&RUN-seq, ATAC-seq (black) and anti-H3K27Ac (green) CUT&RUN-seq profiles in WT and TFAP2-KO cells. Examples of MITF binding at (B) a TFAP2-pioneered-and-activated enhancer (C) a TFAP2-pioneered-and-activated promoter (D) a non-pioneered TFAP2-activated enhancer and (E) a TFAP2-pioneered-and-inhibited enhancer. Genotypes as labeled; y-axis in F applies to F-I, etc. (F-I’) Violin plots representing (F,G,H,I) anti-MITF CUT&RUN-seq (two independent replicates), and (F’, G’,H’, I’) ATAC-seq (four independent replicates) at the indicated number of peaks. P-value according to Student’s t-test, ns; not statistically significant, normalized reads RPKM. Association with gene expression; hypergeometric analysis of TFAP2-dependent and TFAP2-inhibited MITF peaks are shown at TFAP2-activated and MITF-activated genes (FDR < 0.05, log2FC > |1|). (F”- I”) Schematic representation of TFAP2-pioneered-and-activated, TFAP2-activated and TFAP2-inhibited MITF peaks as labelled; B; BAF complex (SWI/SNF), P; alternative pioneer factor. R; repressor protein. Transcription factor binding sites indicated by small rectangles, TFAP2 (red), MITF (blue) and alternative pioneer factor (yellow), example activator SOX10 (green). (F”’–I”’) Enrichment of transcription factor motifs using HOMER at (F”’) TFAP2-pioneered -and-activated MITF peaks, (G”’) non-pioneered TFAP2-activated MITF peaks, (H”’) mutually dependent peaks and (I”’) TFAP2-inhibited MITF peaks. TF; transcription factor. |