
- Title
-
TFAP2 paralogs facilitate chromatin access for MITF at pigmentation and cell proliferation genes
- Authors
- Kenny, C., Dilshat, R., Seberg, H.E., Van Otterloo, E., Bonde, G., Helverson, A., Franke, C.M., Steingrímsson, E., Cornell, R.A.
- Source
- Full text @ PLoS Genet.

Expression of tfap2 paralogs in the melanophore lineage precedes activation of Mitfa-target genes in-vivo.
(A) Uniform Manifold Approximation and Projection (UMAP) obtained after clustering (dimensions, dims = 30, resolution = 1.2) GFP+ cells (n = 11,217 cells) sorted from Tg(mitfa:GFP) zebrafish embryos at 28 hours post fertilization (hpf). Annotated cell clusters as labelled. (B) UMAP obtained after re-clustering sox10-expressing clusters 6–12 (n = 1918 cells). Black line—Monocle pseudotime trajectory analysis starting at foxd3+ neural crest cells showing the progression through different pigment cell clusters as shown. (C-F) Violin plots showing expression of select genes foxd3, mitfa, tfap2e and dct for each cell cluster represented in B. Blue arrows point to the MIX-tfap2-low cluster, and show that mitfa, but not pigmentation genes, are expressed in this cluster (tfap2a is also expressed in this cluster). Red arrows point to the MIX-tfap2-high cluster, and show that mitfa, tfap2e, and pigmentation genes are expressed in this cluster. (G) Dot plot representing the expression of sox10, tfap2 paralogs, mitfa and Mitfa-target genes, and the percentage of cells expressing these genes in neural crest, MIX, MX and melanophore clusters. Expression of tfap2 paralogs are highlighted in MIX tfap2-low and MIX tfap2-high clusters (red box). Size of dots represents percentage of cells expressing the gene, and blue-red scale (low-high) represents relative average expression among cells. (H-K) Lateral views of head and trunk of live embryos at 29 hpf, anterior to the left and dorsal to the top. Genotype as shown. Boxes, regions magnified in accompanying panels H’-K.’ (H-H’) A wild-type or heterozygous mutant (sibling) embryo with normal melanophores (white arrowheads). (I-I’) A tfap2eui157/ui157 embryo, with melanophores that are normal in terms of number, differentiation and pigmentation (white arrowheads). (J-J’) A tfap2alow/low homozygous mutant embryo, with fewer melanophores than tfap2eui157ui/157 and WT sibling embryos. (K-K’) A tfap2alow/low; tfap2e ui157ui/157 double-mutant embryo, with fewer and paler melanophores than in tfap2alow/low siblings. (L) Box plot illustrating the number of pigmented melanophores in the dorsum of tfap2alow/low, tfap2alow/low; tfap2e+/ ui157, and tfap2alow/low; tfap2eui157/ui157 double mutant embryos at 36 hpf. Center line, mean; box limits, upper and lower quartiles; whiskers, minimum and maximum values; black dots, number of melanocytes per individual embryo (tfap2alow/low; n = 9, tfap2alow/low; tfap2e+/ui157; n = 32, tfap2alow/low; tfap2eui157/ui157, n = 10). P-value according to the Student’s t-test. |
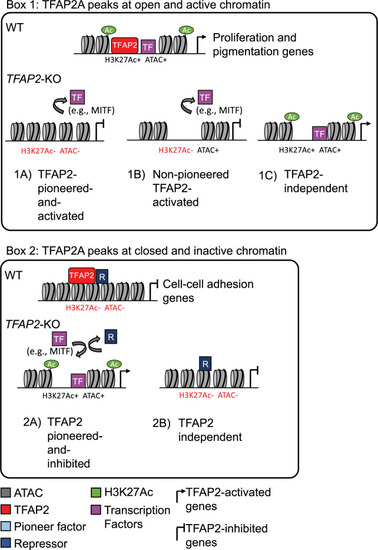
Categories of TFAP2-regulated enhancers.
Box 1: TFAP2A peaks at open and active chromatin. (1A) TFAP2-pioneered-and-activated enhancers show reduced nucleosome accessibility (ATAC-seq) and reduced levels of active chromatin marks (H3K27Ac and H3K4Me3) in TFAP2-KO cells compared to in WT cells. We infer that TFAP2 paralogs pioneer chromatin access for transcriptional co-activators, like MITF and SOX10 (purple box), that in turn recruit chromatin remodelling enzymes and histone modifying enzymes. (1B) Non-pioneered TFAP2-activated enhancers show loss of active chromatin marks but unchanged nucleosome accessibility in TFAP2-KO cells compared to in WT cells. At these enhancers, we infer that TFAP2 paralogs recruit the binding of transcription factors that, in turn, recruit histone modifying enzymes. TFAP2 paralogs also may recruit such enzymes. It is possible that these elements are stably pioneered by TFAP2 paralogs 94. (1C) At TFAP2-independent elements, neither the nucleosome accessibility nor active histone marks are altered in TFAP2-KO cells relative to in WT cells. Both types of TFAP2-activated enhancer are significantly enriched near genes whose expression is reduced in TFAP2-KO cells relative to in WT cells (i.e., TFAP2-activated genes). Such genes are associated with the gene ontology (GO) terms cell proliferation and pigmentation. TFAP2-independent elements are associated with neither TFAP2-activated nor TFAP2-inhibited genes. Box 2: TFAP2A peaks at closed and inactive chromatin. (2A) TFAP2-pioneered-and-inhibited enhancers show increased nucleosome accessibility and increased levels active chromatin marks in TFAP2-KO cells compared to in WT cells. At these sites we infer that TFAP2 paralogs recruit or stabilize the binding of enzymes that condense chromatin and that inhibit the binding of transcriptional activators that are otherwise inclined to bind at them. These elements are significantly enriched near genes whose expression is elevated in TFAP2-KO cells relative to in WT cells (i.e., TFAP2-inhibited genes). Such genes were associated with the GO terms cell-cell adhesion and cell migration. (2B) At TFAP2-independent elements, neither the nucleosome accessibility nor active histone marks are altered in TFAP2-KO cells relative to in WT cells. These elements were associated with neither TFAP2-activated nor TFAP2-inhibited genes. |
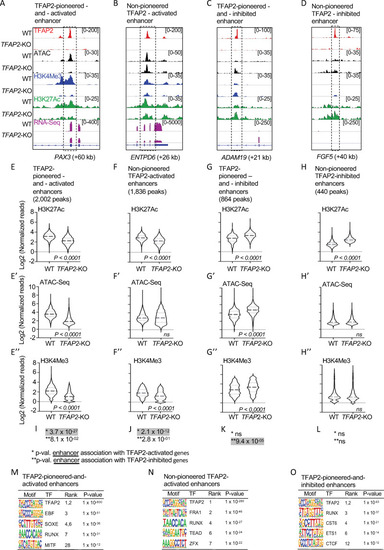
TFAP2 paralogs facilitate gene expression by opening and condensing chromatin.
(A-D) Screenshot of IGV genome browser (GRCH37/hg19), visualizing anti-TFAP2A CUT&RUN-seq (red), ATAC-seq (black), anti-H3K4Me3 CUT&RUN-seq (blue), anti-H3K27Ac CUT&RUN-seq (green) and RNA-seq (magenta) datasets at: (A) an TFAP2-pioneered-and-activated enhancer at the PAX3 (+60 kb) locus; (B) a non-pioneered TFAP2A-activated enhancer at the ENTPD6 (+26kb) locus; (C) an TFAP2-pioneered-and-inhibited enhancer at the ADAM19 (+21 kb) locus; and (D) a non-pioneered TFAP2A-inhibited enhancer at the FGF5 (+40kb) locus. Genotypes as labeled; y-axis in E applies to E-H, etc. (E-H”) Violin plots conveying normalized reads of (E-H) anti-H3K27Ac (two independent replicates), (E’-H’) ATAC-seq (four independent replicates) and (E”-H”) anti-H3K4Me3 (two independent replicates) CUT&RUN-seq at E-E”) TFAP2-pioneered-and-activated enhancers, (F-F”) non-pioneered TFAP2-activated enhancers, (G-G”) TFAP2-pioneered-and-inhibited enhancers, and (H-H”) non-pioneered TFAP2-inhibited enhancers. The number of peaks in each group is indicated. P-values shown were determined by Student’s t-test. (I-L) Hypergeometric analysis of TFAP2 regulated enhancers at TFAP2-activated (*) and TFAP2-inhibited (**) genes in WT cells (FDR < 0.05, |log2FC| > 1). ns; not significant. (M-O) Enrichment of transcription factor binding motifs at (M) TFAP2-pioneered-and-activated enhancers, at (N) non-pioneered TFAP2-activated enhancers and at (O) TFAP2-pioneered-and-inhibited enhancers as determined using HOMER motif analysis. P values were calculated using ZOOPS scoring (zero or one occurrence per sequence) coupled with hypergeometric enrichment analysis. TF; transcription factor. |
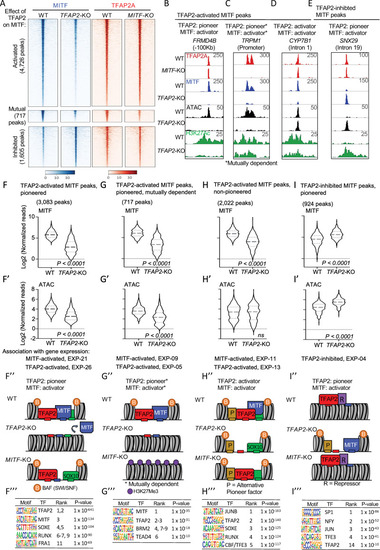
TFAP2 paralogs facilitate chromatin access by MITF.
(A) Density heatmaps of anti-MITF CUT&RUN-seq in WT and TFAP2-KO SK-MEL-28 cells, and anti-TFAP2 CUT&RUN-seq in WT and MITF-KO SK-MEL-28 cells at TFAP2-dependent MITF peaks (first cluster), mutually dependent peaks (second cluster) and TFAP2-inhibited MITF peaks (third cluster). Number of peaks in each group as labelled. Regions shown are +/- 3 kb from peak center, normalized reads (RPKM). (B-E) Screenshot of IGV genome browser (GRCH37/hg19), showing anti-TFAP2A (red) CUT&RUN-seq in WT and MITF-KO cells, and anti-MITF (blue) CUT&RUN-seq, ATAC-seq (black) and anti-H3K27Ac (green) CUT&RUN-seq profiles in WT and TFAP2-KO cells. Examples of MITF binding at (B) a TFAP2-pioneered-and-activated enhancer (C) a TFAP2-pioneered-and-activated promoter (D) a non-pioneered TFAP2-activated enhancer and (E) a TFAP2-pioneered-and-inhibited enhancer. Genotypes as labeled; y-axis in F applies to F-I, etc. (F-I’) Violin plots representing (F,G,H,I) anti-MITF CUT&RUN-seq (two independent replicates), and (F’, G’,H’, I’) ATAC-seq (four independent replicates) at the indicated number of peaks. P-value according to Student’s t-test, ns; not statistically significant, normalized reads RPKM. Association with gene expression; hypergeometric analysis of TFAP2-dependent and TFAP2-inhibited MITF peaks are shown at TFAP2-activated and MITF-activated genes (FDR < 0.05, log2FC > |1|). (F”- I”) Schematic representation of TFAP2-pioneered-and-activated, TFAP2-activated and TFAP2-inhibited MITF peaks as labelled; B; BAF complex (SWI/SNF), P; alternative pioneer factor. R; repressor protein. Transcription factor binding sites indicated by small rectangles, TFAP2 (red), MITF (blue) and alternative pioneer factor (yellow), example activator SOX10 (green). (F”’–I”’) Enrichment of transcription factor motifs using HOMER at (F”’) TFAP2-pioneered -and-activated MITF peaks, (G”’) non-pioneered TFAP2-activated MITF peaks, (H”’) mutually dependent peaks and (I”’) TFAP2-inhibited MITF peaks. TF; transcription factor. |

TFAP2 and MITF co-regulate pigmentation and cell differentiation genes in SK-MEL-28 cell lines.
(A) Venn diagram representing the overlap of genes apparently directly activated by MITF (i.e., expression lower in MITF-KO than in WT cells, FDR < 0.05, and an MITF peak within 100kb of the TSS) and genes directly activated by TFAP2 (i.e., expression lower in TFAP2-KO than in WT cells, FDR < 0.05, and an TFAP2-activated enhancer of any category within 100kb of the TSS). The number of overlapping genes with TFAP2-dependent MITF peaks are also shown (*). (B) Gene ontology (GO) biological process analysis enriched among MITF- and TFAP2-activated genes are shown (Top 5 hits). (C) A curated list of pigment-associated genes [118] was intersected with directly MITF-activated genes, overlapping genes of directly MITF- and TFAP2-activated genes, and directly TFAP2-acitvated genes and represented by gene list. (D) Venn diagram representing directly MITF inhibited genes (MITF peak within 100kb of a TSS), based on RNA-seq, in MITF-KO versus WT cells (FDR < 0.05) and directly TFAP2 inhibited genes (TFAP2-inhibited enhancers, of any category, within 100kb of a TSS), based on RNA-seq, in TFAP2-KO versus WT cells (FDR < 0.05). (E) Gene ontology (GO) biological process analysis enriched among MITF- and TFAP2-inhibited genes are shown (Top 5 most enriched GO terms). GO analysis was performed using PANTHER. (F) Dot plot of enrichment analysis showing the enrichment of melanoma gene signatures from the literature in directly TFAP2-activated and TFAP2-inhibted genes. P value is red lowest to blue highest; gene ratio is the fraction of all genes in the gene signature category that are included in the set identified here. TFAP2-activated genes associated with TFAP2-dependent MITF peaks are shown (*). |
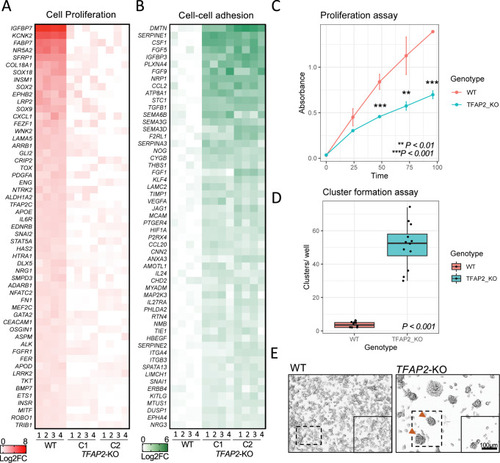
TFAP2 paralogs promote cell proliferation and inhibit cell-cell adhesion a melanoma cell line.
(A) Heatmap representing the top 55 directly TFAP2-activated genes and (B) the top 55 directly TFAP2-inhibited genes that are associated with the GO terms cell pigmentation and cell-cell adhesion, respectively. Four replicate RNA-Seq experiments are shown for WT cells and two clones of TFAP2-KO cells (Clone 2.12 and Clone 4.3) (FDR < 0.05). (C) Growth curves (mean ± SE of mean) over 100 hours of cultivation for WT and TFAP2-KO SK-MEL-28 cells. x-axis is time and y-axis is absorbance at 450nm which is directly proportional to number of living. (D) Box plots representing the quantification of cluster formation on low-bind plates after 72 hours of culture (n = 12 independent experiments, p < 0.001 by Student’s t-test, plot shows mean ± SD). (E) Representative images of clusters formed in WT and TFAP2-KO cells after 72 hours. |

ZFIN is incorporating published figure images and captions as part of an ongoing project. Figures from some publications have not yet been curated, or are not available for display because of copyright restrictions. |
|
ZFIN is incorporating published figure images and captions as part of an ongoing project. Figures from some publications have not yet been curated, or are not available for display because of copyright restrictions. |