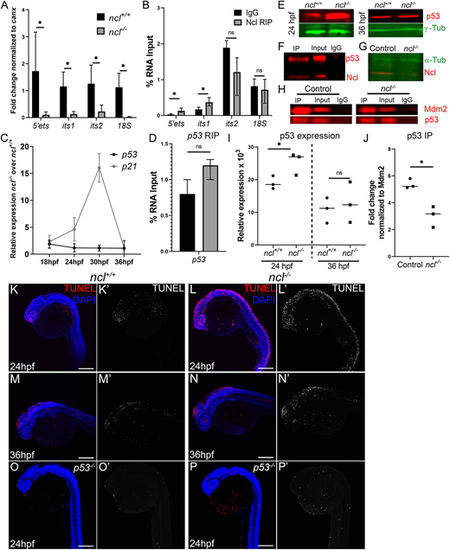
Nucleolin is required for rRNA transcription and p53 regulation. (A) qPCR for 5′ETS, ITS1, ITS2 and 18S segment of the pre-rRNA in ncl+/+ and ncl−/− zebrafish (n=10 per sample) indicates that rRNA transcripts were significantly lower in ncl−/− embryos compared with their ncl+/+ siblings. canx was used as an internal control. (B) RNA immunoprecipitation (RIP) using a Nucleolin-specific antibody indicates that Nucleolin binds to the 5′ETS and ITS1 region of the 47S rRNA but not to the ITS2 or 18S in wild-type zebrafish (n=100 per replicate and condition). The y-axis indicates fold change of RNA pulldown compared with its absolute expression in the embryos. (C) p53 transcript expression was not significantly altered in ncl−/− mutant zebrafish between 18 and 36 hpf; however, expression of its downstream target p21 was significantly higher between 24 and 30 hpf in the ncl−/− mutants compared with wild-type zebrafish (n=5 per sample). (D) Nucleolin and IgG binding to p53 mRNA was similar in wild-type zebrafish, as observed by RNA immunoprecipitation (n=100 per replicate and condition). The y-axis indicates fold change of RNA pulldown compared with its absolute expression in the embryos. (E) p53 protein levels were higher in ncl−/− mutants at 24 hpf compared with their ncl+/+ siblings and comparable between ncl+/+ and ncl−/− embryos at 36 hpf as observed by western blotting (n=5 per sample). γ-tubulin was used as a loading control. (F) Immunoprecipitation (IP) with a Nucleolin-specific antibody followed by western blotting for p53 and Nucleolin indicates that p53 and Nucleolin bind to each other in wild-type zebrafish (n=25 per replicate and condition). (G) In ncl−/− mutants, Nucleolin expression was significantly reduced compared with controls (n=25 per replicate). α-tubulin was used as a loading control. (H) At 28 hpf, control zebrafish displayed higher binding of Mdm2 and p53 compared with that seen in mutant zebrafish (n=25 per replicate and condition). (I) Quantification of p53 protein levels in 24 hpf and 36 hpf ncl+/+ and ncl−/− embryos (n=3). (J) Quantification of p53-Mdm2 binding in ncl+/+ and ncl−/− embryos (n=3). (K-L′) ncl−/− mutants have more TUNEL+ cells (red in K,L; white in K′,L′) at 24 hpf compared with their ncl+/+ siblings (n=15 per genotype). (M-N′) By 36 hpf, apoptosis (red in M,N; white in M′,N′) is confined to the midbrain-hindbrain boundary in both ncl+/+ and ncl−/− embryos (n=15 per genotype). (O-P′) On a p53−/− mutant background, the number of TUNEL+ cells (red in O,P; white in O′,P′) in both ncl+/+ and ncl−/− embryos (n=15 per genotype) at 24 hpf is reduced. All experiments were performed three times. Scale bars: 70 µm. Data are represented as mean±s.d. in A-D; circles and squares represent individual data points and horizontal lines represent the mean in I,J. ns, not significant; *P<0.05 (two-tailed, paired Student's t-test).
|
