
Fig. 2
- ID
- ZDB-FIG-220629-74
- Publication
- Dash et al., 2022 - Nucleolin loss of function leads to aberrant Fibroblast Growth Factor signaling and craniofacial anomalies
- Other Figures
- All Figure Page
- Back to All Figure Page
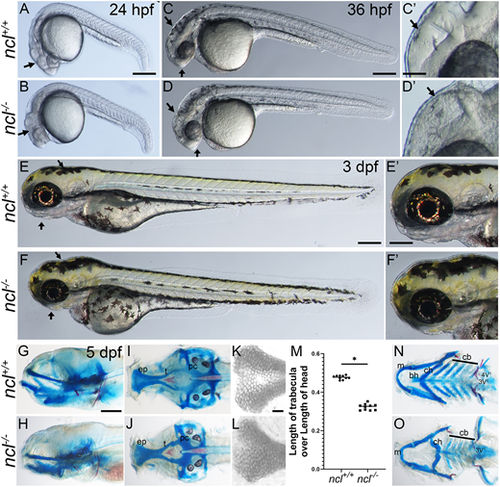
ncl−/− mutants exhibit craniofacial defects. (A,B) Compared with 24 hpf ncl+/+ clutch mates, ncl−/− mutants had necrotic tissue (indicated by black arrows) in the craniofacial region (n=25). (C,D) By 36 hpf, the frontonasal prominence and midbrain-hindbrain boundary were misshapen in ncl−/− mutants compared with their ncl+/+ siblings (indicated by black arrows) (n=50). The craniofacial region is magnified in C′,D′. (E,F) At 3 dpf, the ncl−/− mutants had smaller jaws and a misshapen head (indicated by black arrows) (n=15). The craniofacial region is magnified in E′,F′. (G,H) Skeletal preparations of 5 dpf wild-type and ncl−/− mutant zebrafish reveal defects in the cartilages of the jaw (n=50). (I,J) In the neurocranium, the chondrocytes in the ethmoid plate were delayed in development, and the trabeculae were smaller and wider compared with the wild-type zebrafish at the same stage. (K,L) Magnified images of the ethmoid plate showing differential Alcian Blue staining, as well as the loss of medial cells in ncl−/− larvae. (M) Quantification of the length of trabecula in ncl+/+ and ncl−/− embryos as a ratio of the length of the head measured from the anterior-most point of the ethmoid plate to the posterior-most point of the parachordal (pc) (n=10). Horizontal lines represent the mean. *P<0.05 (two-tailed, paired Student's t-test). (N,O) In the viscerocranium, Meckel's cartilage was bent, the basihyal was missing, the polarity of the ceratohyal was inverted and the ceratobranchials were hypoplastic. In addition, the mutants had hypoplastic teeth and the 4V1 teeth were missing. The experiment was performed three times. ep, ethmoid plate; t, trabecula; pc, parachordal; m, Meckel's cartilage; bh, basihyal; ch, ceratohyal; cb, ceratobranchial. Scale bars: 200 µm (A-F); 50 µm (C′-F′); 70 µm (G-J,N,O); 25 µm (K,L). |
| Fish: | |
|---|---|
| Observed In: | |
| Stage Range: | Prim-5 to Day 5 |