FIGURE

FIGURE 2

ID
ZDB-FIG-220612-2
Publication
Zhang et al., 2022 - Connectivity Mapping Using a Novel sv2a Loss-of-Function Zebrafish Epilepsy Model as a Powerful Strategy for Anti-epileptic Drug Discovery
Other Figures
All Figure Page
Back to All Figure Page
FIGURE 2

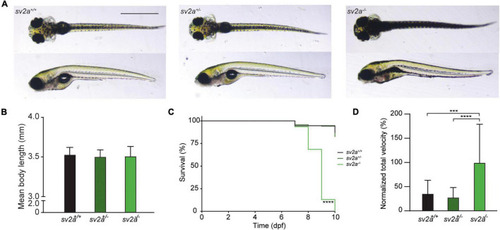
Morphological, survival and behavioral analysis of sv2a knockout zebrafish. (A) Representative images of sv2a+/+, sv2a+/–, and sv2a –/– zebrafish larvae at 6 dpf. Scale bar 1 mm. (B) Comparison of mean body length of sv2a+/+ (n = 8), sv2a+/– (n = 8), and sv2a –/– (n = 8) zebrafish larvae at 6 dpf (mean ± SD). (C) Kaplan-Meier curve demonstrating survival of sv2a+/+ (n = 94), sv2a+/– (n = 208), and sv2a–/– (n = 92) zebrafish larvae. Significant larval death in sv2a–/– larvae can be observed in a time-dependent manner. Statistical analysis was performed using Log-rank (Mantel-Cox) test (****p < 0.0001). (D) Locomotor activity of sv2a+/+ (n = 15), sv2a+/– (n = 53), and sv2a–/– (n = 40) zebrafish larvae at 6 dpf. Data were assessed over the total tracking period of 10 min, normalized to sv2a–/– larvae, and expressed as normalized total velocity (%) (mean ± SD). Statistical analysis was performed by one-way ANOVA followed by Dunnett’s multiple comparison (***p < 0.001, ****p < 0.0001). Data were collected from four independent experiments.

Expression Data

Expression Detail
Antibody Labeling
Phenotype Data
Fish:
Observed In:
Stage Range: Day 6 to Days 7-13

Phenotype Detail
Acknowledgments
This image is the copyrighted work of the attributed author or publisher, and ZFIN has permission only to display this image to its users. Additional permissions should be obtained from the applicable author or publisher of the image. Full text @ Front. Mol. Neurosci.