IMAGE

FIGURE 2

ID
ZDB-IMAGE-220612-2
Source
Figures for Zhang et al., 2022
Image
Figure Caption

FIGURE 2

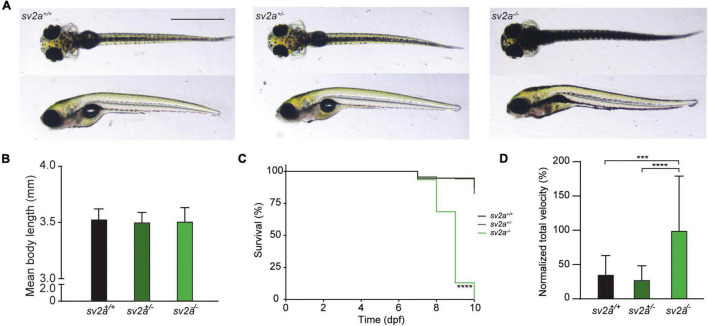
Morphological, survival and behavioral analysis of sv2a knockout zebrafish. (A) Representative images of sv2a+/+, sv2a+/–, and sv2a –/– zebrafish larvae at 6 dpf. Scale bar 1 mm. (B) Comparison of mean body length of sv2a+/+ (n = 8), sv2a+/– (n = 8), and sv2a –/– (n = 8) zebrafish larvae at 6 dpf (mean ± SD). (C) Kaplan-Meier curve demonstrating survival of sv2a+/+ (n = 94), sv2a+/– (n = 208), and sv2a–/– (n = 92) zebrafish larvae. Significant larval death in sv2a–/– larvae can be observed in a time-dependent manner. Statistical analysis was performed using Log-rank (Mantel-Cox) test (****p < 0.0001). (D) Locomotor activity of sv2a+/+ (n = 15), sv2a+/– (n = 53), and sv2a–/– (n = 40) zebrafish larvae at 6 dpf. Data were assessed over the total tracking period of 10 min, normalized to sv2a–/– larvae, and expressed as normalized total velocity (%) (mean ± SD). Statistical analysis was performed by one-way ANOVA followed by Dunnett’s multiple comparison (***p < 0.001, ****p < 0.0001). Data were collected from four independent experiments.

Figure Data
Acknowledgments
This image is the copyrighted work of the attributed author or publisher, and ZFIN has permission only to display this image to its users. Additional permissions should be obtained from the applicable author or publisher of the image. Full text @ Front. Mol. Neurosci.