FIGURE SUMMARY
Title

Connectivity Mapping Using a Novel sv2a Loss-of-Function Zebrafish Epilepsy Model as a Powerful Strategy for Anti-epileptic Drug Discovery

Authors
Zhang, Y., Heylen, L., Partoens, M., Mills, J.D., Kaminski, R.M., Godard, P., Gillard, M., de Witte, P.A.M., Siekierska, A.
Source
Full text @ Front. Mol. Neurosci.

sv2a expression in developing zebrafish larvae (1-7 dpf) and CRISPR-mediated sv2a knockout in zebrafish. (A) qPCR analysis of sv2a mRNA levels in wildtype larvae normalized to 18s and represented as the fold expression to 1 dpf. Values are reported as mean ± SD of three independent experiments. (B) Schematic representation of the SV2A protein with the two distinct transmembrane (TM) domains and the cytosolic synaptogamin binding site. Gray dashed line indicates exon 1 encoding synaptogamin binding domain and the first two TM helices. Red dashed line magnifies the region with the 1 nucleotide insertion (G) at the target site in exon 1. (C) High resolution melting (HRM) curve analysis discriminates sv2a+/+, sv2a+/–, and sv2a–/– zebrafish larvae at 6 dpf. (D) qPCR analysis of sv2a mRNA levels in sv2a+/+, sv2a+/–, and sv2a–/– larvae at 6 dpf normalized to 18s and represented as the fold expression to sv2a+/+ larvae. Values are reported as the mean ± SD of three independent experiments.

EXPRESSION / LABELING:
Gene:
Fish:
Anatomical Term:
Stage Range: Prim-5 to Days 7-13
PHENOTYPE:
Fish:
Observed In:
Stage: Day 6

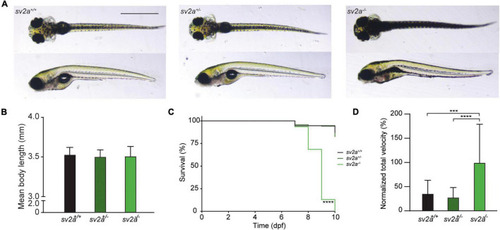
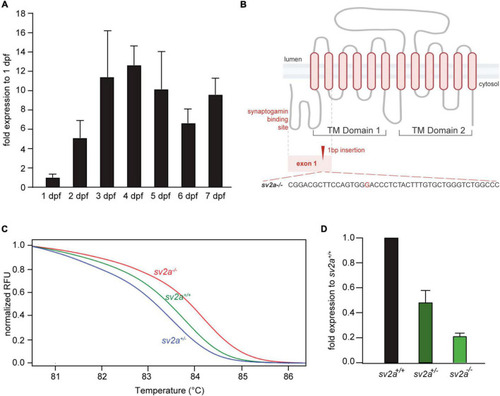
Morphological, survival and behavioral analysis of sv2a knockout zebrafish. (A) Representative images of sv2a+/+, sv2a+/–, and sv2a –/– zebrafish larvae at 6 dpf. Scale bar 1 mm. (B) Comparison of mean body length of sv2a+/+ (n = 8), sv2a+/– (n = 8), and sv2a –/– (n = 8) zebrafish larvae at 6 dpf (mean ± SD). (C) Kaplan-Meier curve demonstrating survival of sv2a+/+ (n = 94), sv2a+/– (n = 208), and sv2a–/– (n = 92) zebrafish larvae. Significant larval death in sv2a–/– larvae can be observed in a time-dependent manner. Statistical analysis was performed using Log-rank (Mantel-Cox) test (****p < 0.0001). (D) Locomotor activity of sv2a+/+ (n = 15), sv2a+/– (n = 53), and sv2a–/– (n = 40) zebrafish larvae at 6 dpf. Data were assessed over the total tracking period of 10 min, normalized to sv2a–/– larvae, and expressed as normalized total velocity (%) (mean ± SD). Statistical analysis was performed by one-way ANOVA followed by Dunnett’s multiple comparison (***p < 0.001, ****p < 0.0001). Data were collected from four independent experiments.

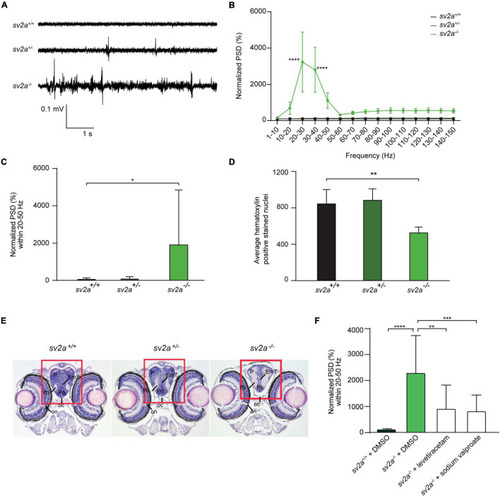
Spontaneous electrographic seizures and brain malformation in sv2a knockout zebrafish. (A) Representative local field potential (LFP) recordings of sv2a+/+, sv2a+/–, and sv2a –/– zebrafish larvae at 6 dpf. (B) Power spectral density (PSD) analysis of sv2a+/+ (n = 9), sv2a+/– (n = 11), and sv2a –/– (n = 10) zebrafish larvae at 6 dpf. A significant increase in PSD values was observed in sv2a–/– larvae compared to sv2a+/+ larvae. Results were normalized to sv2a+/+ larvae as 100%. Statistical analysis was performed using two-way ANOVA with Sidak’s multiple comparisons test (****p < 0.0001 compared to sv2a+/+). (C) PSD values (mean ± SD) plotted per condition over the 20–50 Hz region. Statistical analysis was performed using one-way ANOVA followed by Dunnett’s multiple comparison (*p < 0.05). (D) Hematoxylin-positive stained nuclei (mean ± SD) counted using QuPath (0.1.2) software. The region with significant loss of hematoxylin-positive stained nuclei was highlighted in red. The results are expressed as mean ± SD of 4 equivalent sections per genotype. Statistical analysis was performed using one-way ANOVA followed by Dunnett’s multiple comparison (**p < 0.01). (E) Hematoxylin and eosin staining of paraffin-embedded coronary sections from the forebrain of sv2a+/+, sv2a+/–, and sv2a –/– zebrafish larvae at 6 dpf. Scale bar 100 μm. oc, optic chiasm; on, optic nerve; Po, preoptic region; P, pallium; lfb, lateral forebrain bundle. (F) Effect of levetiracetam and sodium valproate on locomotor behavior and epileptiform brain activity in 6 dpf sv2a–/– zebrafish larvae. PSD values (mean ± SD) from LFP recordings at 6 dpf plotted per condition over the 20-50 Hz region for sv2a+/+ and sv2a–/– larvae after incubation with levetiracetam and valproic acid at their MTC or DMSO control at 5 dpf for 22 h. Number of larvae per condition: n = 9–35. Statistical analysis was performed using ordinary one-way ANOVA. **p < 0.01, ***p < 0.001, ****p < 0.0001.

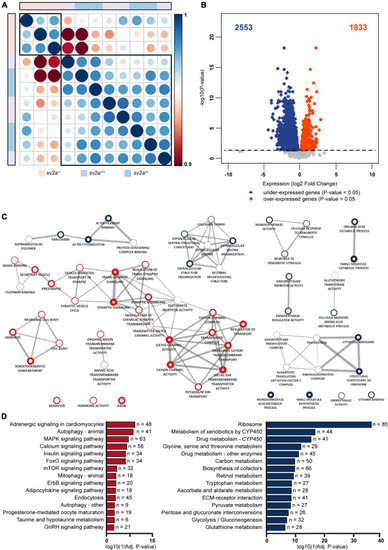
Transcriptome analysis and gene ontology (GO) enrichment map of
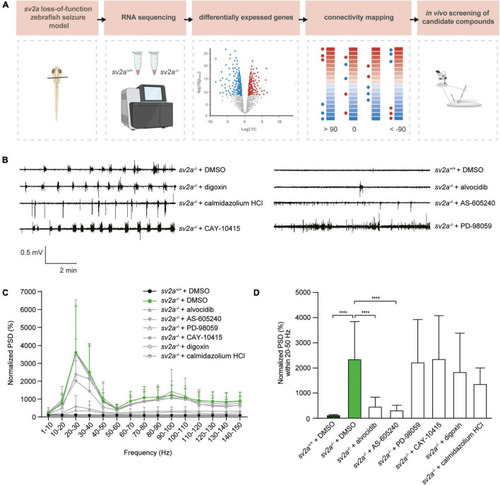
 sv2a–/– larvae. (A) Spearman’s rank correlation matrix of the RNA-Seq data showing separate clustering of sv2a–/– samples from sv2a+/+ and sv2a+/– samples. Scale bar indicates the strength of the correlation, with 1 indicating a strong positive correlation (dark blue) and 0.9 indicating weak correlation (dark red) between samples. Areas of the circles show absolute values of corresponding correlation coefficients. Samples of different genotypes are indicated in distinct colors codes. (B) Volcano plot showing the differentially expressed genes (DEG) (padj < 0.05) between sv2a–/– and sv2a+/+ larvae. Of the 4386 DEGs, 2553 were found to be down- (blue) and 1833 to be up-regulated (red) in sv2a–/– larvae compared to sv2a+/+. (C) GO enrichment map from up- and down-regulated genes between sv2a+/+ and sv2a–/– zebrafish larvae. Each node represents a different GO term, the red and blue outside of nodes indicate enrichment in up- or down-regulated genes, respectively. The larger the node the greater the number of genes in the enriched GO term. Connecting lines indicate common genes shared between nodes, the thicker the line the more genes in common. (D) Enriched pathways from differentially expressed genes between sv2a–/– and sv2a+/+ zebrafish larvae. Pathways enriched amongst up-regulated genes are indicated in red, pathways enriched amongst down-regulated genes are indicated in blue. The x-axis represents the log10 (1/p-value), n indicates the number of genes appearing in each category.

Connectivity mapping in sv2a–/– zebrafish larvae. (A) Overview of the connectivity mapping workflow. Heads of sv2a–/– and sv2a+/+ zebrafish larvae were sampled and RNA was extracted. After RNA sequencing and differential expression analysis, top 50 up- and down-regulated genes in sv2a–/– larvae (compared to sv2a+/+) were selected based on Wald statistic and compared to gene expression profiles of compounds in the CMap database in order to identify compounds reversing the differential expression signature (scores < −90). Three of these compounds (alvocidib, AS-605240, PD-98059) and three negative controls (scores > 90; digoxin, calmidazolium HCl, or equaling zero; CAY-10415) were tested in the sv2a loss-of-function in LFP recordings. (B) Representative LFP recordings of sv2a–/– and sv2a+/+ larvae after incubation with selected CMap compounds at their MTCs or DMSO control at 5 dpf for 22 h. (C) PSD analysis of sv2a–/– and sv2a+/+ larvae after incubation of selected CMap compounds at their MTCs or DMSO control at 5 dpf for 22 h. Results were normalized to sv2a+/+ larvae as 100%. Number of larvae per condition: n = 9–27. (D) Power spectral density (PSD) values (mean ± SD) from LFP recordings at 6 dpf plotted per condition over the 20-50 Hz region for sv2a–/– and sv2a+/+ larvae after incubation of selected CMap compounds at their MTCs or DMSO control at 5 dpf for 22 h. Number of larvae per condition: n = 9–27. Data are presented as mean ± SD. Statistical analysis was performed using ordinary one-way ANOVA. ***p < 0.001, ****p < 0.0001.

Acknowledgments
This image is the copyrighted work of the attributed author or publisher, and ZFIN has permission only to display this image to its users. Additional permissions should be obtained from the applicable author or publisher of the image. Full text @ Front. Mol. Neurosci.