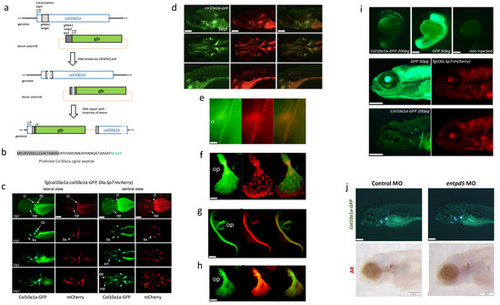
Figure 1. Characterisation of the Tg(col10a1a:col10a1a-GFP) transgenic line. (a) Schematic representation of the endogenous col10a1a gene (top line), the plasmids used for microinjection along with the two gRNAs (bait and col10a1a, respectively gRNA1 and gRNA2), the resulting cuts in the genomic DNA and plasmids, and the expected reporter construct in the transgenic genome. (b) N-terminal end of the fusion protein produced by the Tg(col10a1a:col10a1-GFP) transgenic line, with the predicted signal peptide in grey and the original GFP translational start site (M) in green. (c) Timeline of expression of GFP (green fluorescence) and mCherry (red fluorescence) in double-transgenic larvae Tg(col10a1a:col10a1a-GFP; Ola.Sp7:mCherry). Lateral and ventral views at different developmental stages as indicated, anterior to the left. White arrows point to specific elements: (bs) branchiostegal ray, (cl) cleithrum, (de) dentary, (en) entopterygoid, (mx) maxillary, (op) opercle and (tb) tooth bud. (d) Expression of Col10a1a-GFP protein (green) in 6 dpf Tg(col10a1a:col10a1a-GFP) larvae live-stained with AR to visualize mineralized bone. (e–h) Close inspection of Col10a1a-GFP localization (green) compared to mCherry expression by osteoblasts in (e) the cleithrum (cl) or the opercle (f) of 9 dpf Tg(col10a1a:col10a1a-GFP; Ola.Sp7:mCherry) zebrafish larvae. (g,h) Expression of GFP protein (green) in Tg(col10a1a:col10a1a-GFP) 6 dpf larvae live-stained with AR to visualize bone matrix. Close inspection of the cleithrum (g) and the opercle (h). (i) Zebrafish Tg(Ola.Sp7:mCherry) larvae after microinjection of mRNA coding for GFP or for the fusion protein Col10a1a-GFP. Top: embryos at 1 dpf, showing weak fluorescence of Col10a1a-GFP, extremely strong fluorescence of GFP, and no fluorescence in controls. Bottom: the same larvae at 5 dpf, still showing strong GFP expression in the entire body and weak, but specific fluorescence of Col10a1a-GFP located in bone elements (cleithrum and opercle) as confirmed by the red fluorescence of osteoblast-specific mCherry. (j) Morpholino injection into Tg(col10a1a:col10a1a-GFP) larvae. The Col10a1a-GFP protein labels cranial bone elements at 4 dpf in both control and entpd5 MO injected larvae (top), but AR staining is absent in entpd5 morphants (bottom). The scale bars, given in the left bottom corner of the images, represent 200 µm, except for (e–h), where they indicate 20 µm.
|
